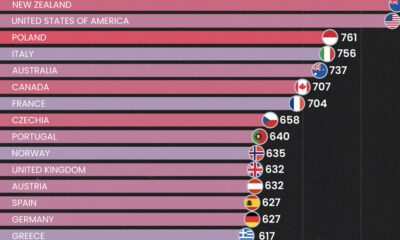

Here are the highest vehicles per capita by country as a growing global middle class is fueling car ownership rates around the world.


Commodity returns in 2023 took a hit. This graphic shows the performance of commodities like gold, oil, nickel, and corn over the last decade.
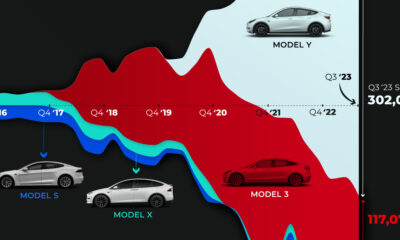

The model mix in tesla's global sales numbers has slowly changed from its luxury lineup to cheaper, high-volume cars.
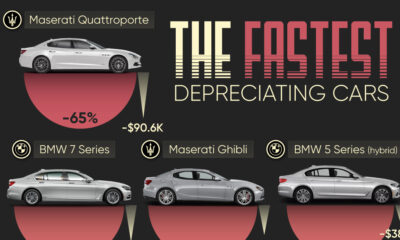

We visualize which cars depreciate the fastest based on the rate their value drops over five years. Spoiler: luxury cars don't do well.
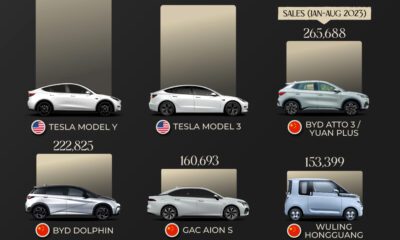

Today, electric vehicle sales make up 18% of global vehicle sales. Here are the leading models by sales as of August 2023.
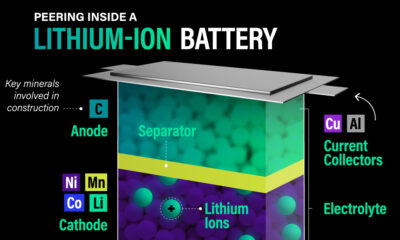

Lithium-ion batteries are critical for many modern technologies, from smartphones to smart cities. Here's how this critical technology works.
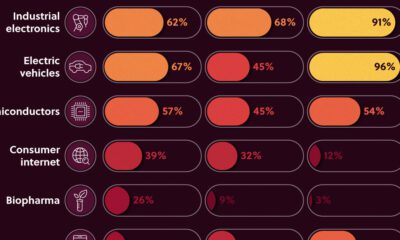

We look at the share of Asian companies in the top 3,000 global firms—measured by market capitalization in 2020—broken down by industry.
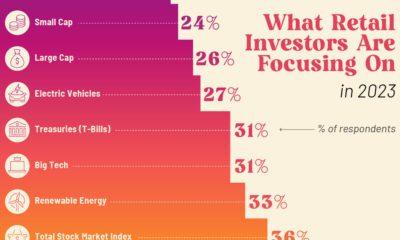

What key themes and strategies are retail investors looking at for the rest of 2023? Preview: AI is a popular choice.
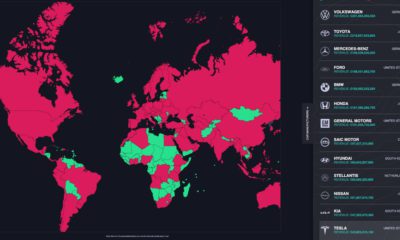

This graphic looks at the revenue of the world’s top carmakers and compares them to the GDP of 196 countries worldwide.
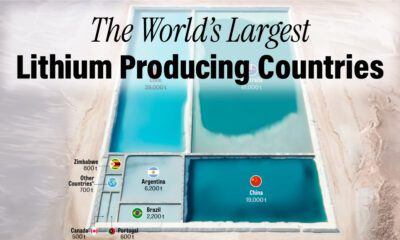

Which countries produce the most lithium, and which have the most in reserves in the ground? We look at 2022 data from the USGS.


 Creator Program