Culture
The World’s Top Media Franchises by All-Time Revenue
![]() See this visualization first on the Voronoi app.
See this visualization first on the Voronoi app.
Global Media Franchises by All-Time Revenue
This was originally posted on our Voronoi app. Download the app for free on iOS or Android and discover incredible data-driven charts from a variety of trusted sources.
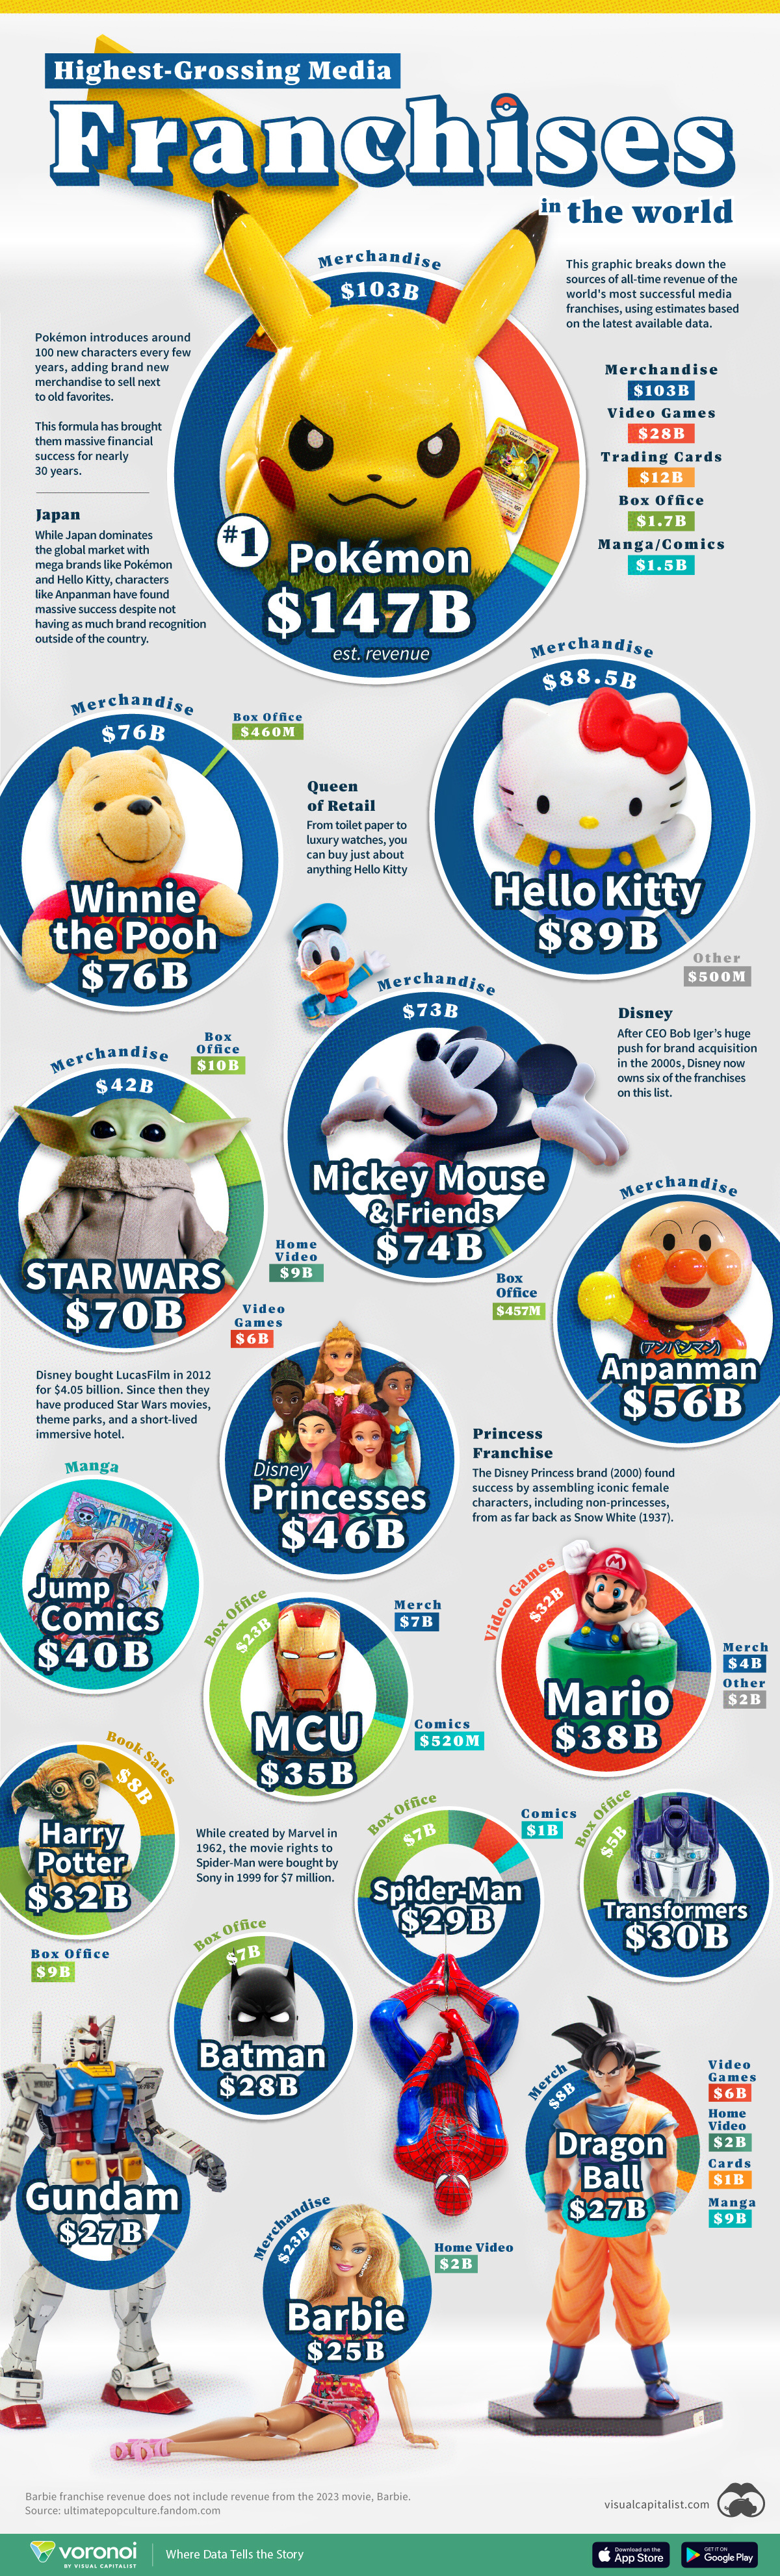
From Pikachu to Hello Kitty, some media franchises become so big that their iconic characters are recognizable to nearly everyone in the world. But how exactly do these mega media franchises make their money, and how do they compare in terms of all-time revenue?
This graphic visualizes and ranks the world’s largest media franchises by their all-time revenue, showing the main revenue sources for each media franchise using data from Fandom.
Japan’s Media Franchises Reign
With more than half of the media franchises in this graphic originating from Japan, the Asian country dominates when it comes to modern popular media franchises.
The country has produced some of the biggest media franchises which span across mediums, whether it’s video games with Pokémon and Mario, or comics, animated series, and toys with franchises like Dragon Ball and Transformers.
| Media Franchise | Total Estimated Revenue | Merchandise Revenue | Video Games Revenue | Trading Cards Revenue | Box Office Revenue | Manga/Comics Revenue | Book Sales Revenue | Home Video Revenue | Other Revenue |
|---|---|---|---|---|---|---|---|---|---|
| Pokémon | $147.0B | $102.9B | $27.6B | $12.1B | $1.8B | $1.5B | - | $0.9B | - |
| Hello Kitty | $89.0B | $88.5B | - | - | - | $0.02B | - | - | - |
| Winnie the Pooh | $76.0B | $76.2B | - | - | $0.5B | - | - | - | - |
| Mickey Mouse & Friends | $74.0B | $73.4B | - | - | $0.5B | $0.0005B | - | - | - |
| Star Wars | $70.0B | $42.2B | $6.0B | - | $10.3B | - | $1.8B | $9.1B | $0.3B |
| Anpanman | $56.0B | $56.4B | - | - | $0.1B | - | - | - | $0.03B |
| Disney Princess | $46.0B | $46.3B | - | - | - | - | - | - | - |
| Jump Comics (Shōnen Jump) | $40.0B | - | $0.2B | - | - | $39.8B | - | - | - |
| Mario | $38.0B | $4.3B | $32.4B | - | $0.0B | $1.6B | - | - | - |
| Marvel Cinematic Universe (MCU) | $35.0B | $12.5B | - | - | $22.6B | $0.001B | - | - | - |
| Harry Potter | $32.0B | $12.3B | $1.6B | - | $9.9B | - | $7.7B | - | $1.1B |
| Transformers | $30.0B | $12.2B | - | - | $4.9B | - | - | - | $0.9B |
| Spider-Man | $29.0B | $15.9B | $1.7B | - | $7.2B | $1.1B | - | $2.2B | $1.4B |
| Batman | $28.0B | $21.3B | - | - | $6.1B | - | - | $1.2B | $0.3B |
| Dragon Ball | $27.0B | $7.7B | $6.2B | $1.0B | $0.8B | $9.2B | - | $2.1B | $0.05B |
| Gundam | $26.9B | $26.4B | - | - | - | $0.2B | - | - | $0.3B |
| Barbie* | $24.7B | $22.7B | - | - | $0.01B | - | - | $2.0B | - |
*Barbie’s revenue does not include revenue from the 2023 movie Barbie.
Even Japanese media franchises which have had less international exposure and revenue, like Anpanman and Jump Comics, have netted tens of billions in revenue mostly from their domestic popularity.
Besides Japan, Disney is the other dominant force when it comes to global media franchises, with all of the 10 largest franchises either hailing from Japan or owned by Disney.
Disney’s Major Media Acquisitions
Over the past two decades, Disney has built up a significant catalog of major media franchises through two key multi-billion dollar acquisitions.
Disney’s acquisitions of Marvel Entertainment for $4.4 billion in 2009 and Lucasfilm for $4.05 billion in 2012 added massive media franchises to their portfolio like Star Wars, the Marvel Cinematic Universe, and Spider-Man.
While Sony bought the movie rights to Spider-Man for just $7 million from Marvel in 1999, Disney owns the rights to Spider-Man in all other forms, including merchandising, television, and comics.
Movies Make their Comeback for Media Franchises
This past decade has seen various popular media franchises take another stab at expanding into the medium of movies and TV shows, this time finding significant success.
Whether it’s animated movies like The Super Mario Bros. Movie or live-action adaptations like Barbie or Netflix’s series of Jump Comics properties like One Piece, these film forays have been successful in revenue terms and in expanding their franchise fanbases.
On top of this, companies like Nintendo are tapping into their franchises to expand beyond movies, with Mario now also the leading mascot for the Super Nintendo World theme park area which has locations at both Universal Studios Japan and Hollywood.


Automotive
How People Get Around in America, Europe, and Asia
Examining how people get around using cars, public transit, and walking or biking, and the regional differences in usage.


How People Get Around in America, Europe, and Asia
This was originally posted on our Voronoi app. Download the app for free on iOS or Android and discover incredible data-driven charts from a variety of trusted sources.
This chart highlights the popularity of different transportation types in the Americas, Europe, and Asia, calculated by modal share.
Data for this article and visualization is sourced from ‘The ABC of Mobility’, a research paper by Rafael Prieto-Curiel (Complexity Science Hub) and Juan P. Ospina (EAFIT University), accessed through ScienceDirect.
The authors gathered their modal share data through travel surveys, which focused on the primary mode of transportation a person employs for each weekday trip. Information from 800 cities across 61 countries was collected for this study.
North American Car Culture Contrasts with the Rest of the World
In the U.S. and Canada, people heavily rely on cars to get around, no matter the size of the city. There are a few exceptions of course, such as New York, Toronto, and smaller college towns across the United States.
| Region | 🚗 Cars | 🚌 Public Transport | 🚶 Walking/Biking |
|---|---|---|---|
| North America* | 92% | 5% | 4% |
| Central America | 23% | 42% | 35% |
| South America | 29% | 40% | 31% |
| Northern Europe | 48% | 29% | 24% |
| Western Europe | 43% | 24% | 34% |
| Southern Europe | 50% | 24% | 25% |
| Eastern Europe | 35% | 40% | 25% |
| Southeastern Asia | 44% | 43% | 13% |
| Western Asia | 43% | 28% | 29% |
| Southern Asia | 22% | 39% | 39% |
| Eastern Asia | 19% | 46% | 35% |
| World | 51% | 26% | 22% |
Note: *Excluding Mexico. Percentages are rounded.
As a result, North America’s share of public transport and active mobility (walking and biking) is the lowest amongst all surveyed regions by a significant amount.
On the other hand, public transport reigns supreme in South and Central America as well as Southern and Eastern Asia. It ties with cars in Southeastern Asia, and is eclipsed by cars in Western Asia.
As outlined in the paper, Europe sees more city-level differences in transport popularity.
For example, Utrecht, Netherlands prefers walking and biking. People in Paris and London like using their extensive transit systems. And in Manchester and Rome, roughly two out of three journeys are by car.

-

 Energy4 days ago
Who’s Building the Most Solar Energy?
-

 Wealth2 weeks ago
Charted: Which Country Has the Most Billionaires in 2024?
-

 Markets2 weeks ago
The Top Private Equity Firms by Country
-

 Jobs1 week ago
The Best U.S. Companies to Work for According to LinkedIn
-

 Economy1 week ago
Ranked: The Top 20 Countries in Debt to China
-

 Misc1 week ago
Charted: Trust in Government Institutions by G7 Countries
-

 Energy1 week ago
Mapped: The Age of Energy Projects in Interconnection Queues, by State
-

 Mining1 week ago
Visualizing Global Gold Production in 2023