Markets
Charted: Marvel’s Box Office Rise (and Fall?)
Charted: Marvel’s Box Office Rise (and Fall?)
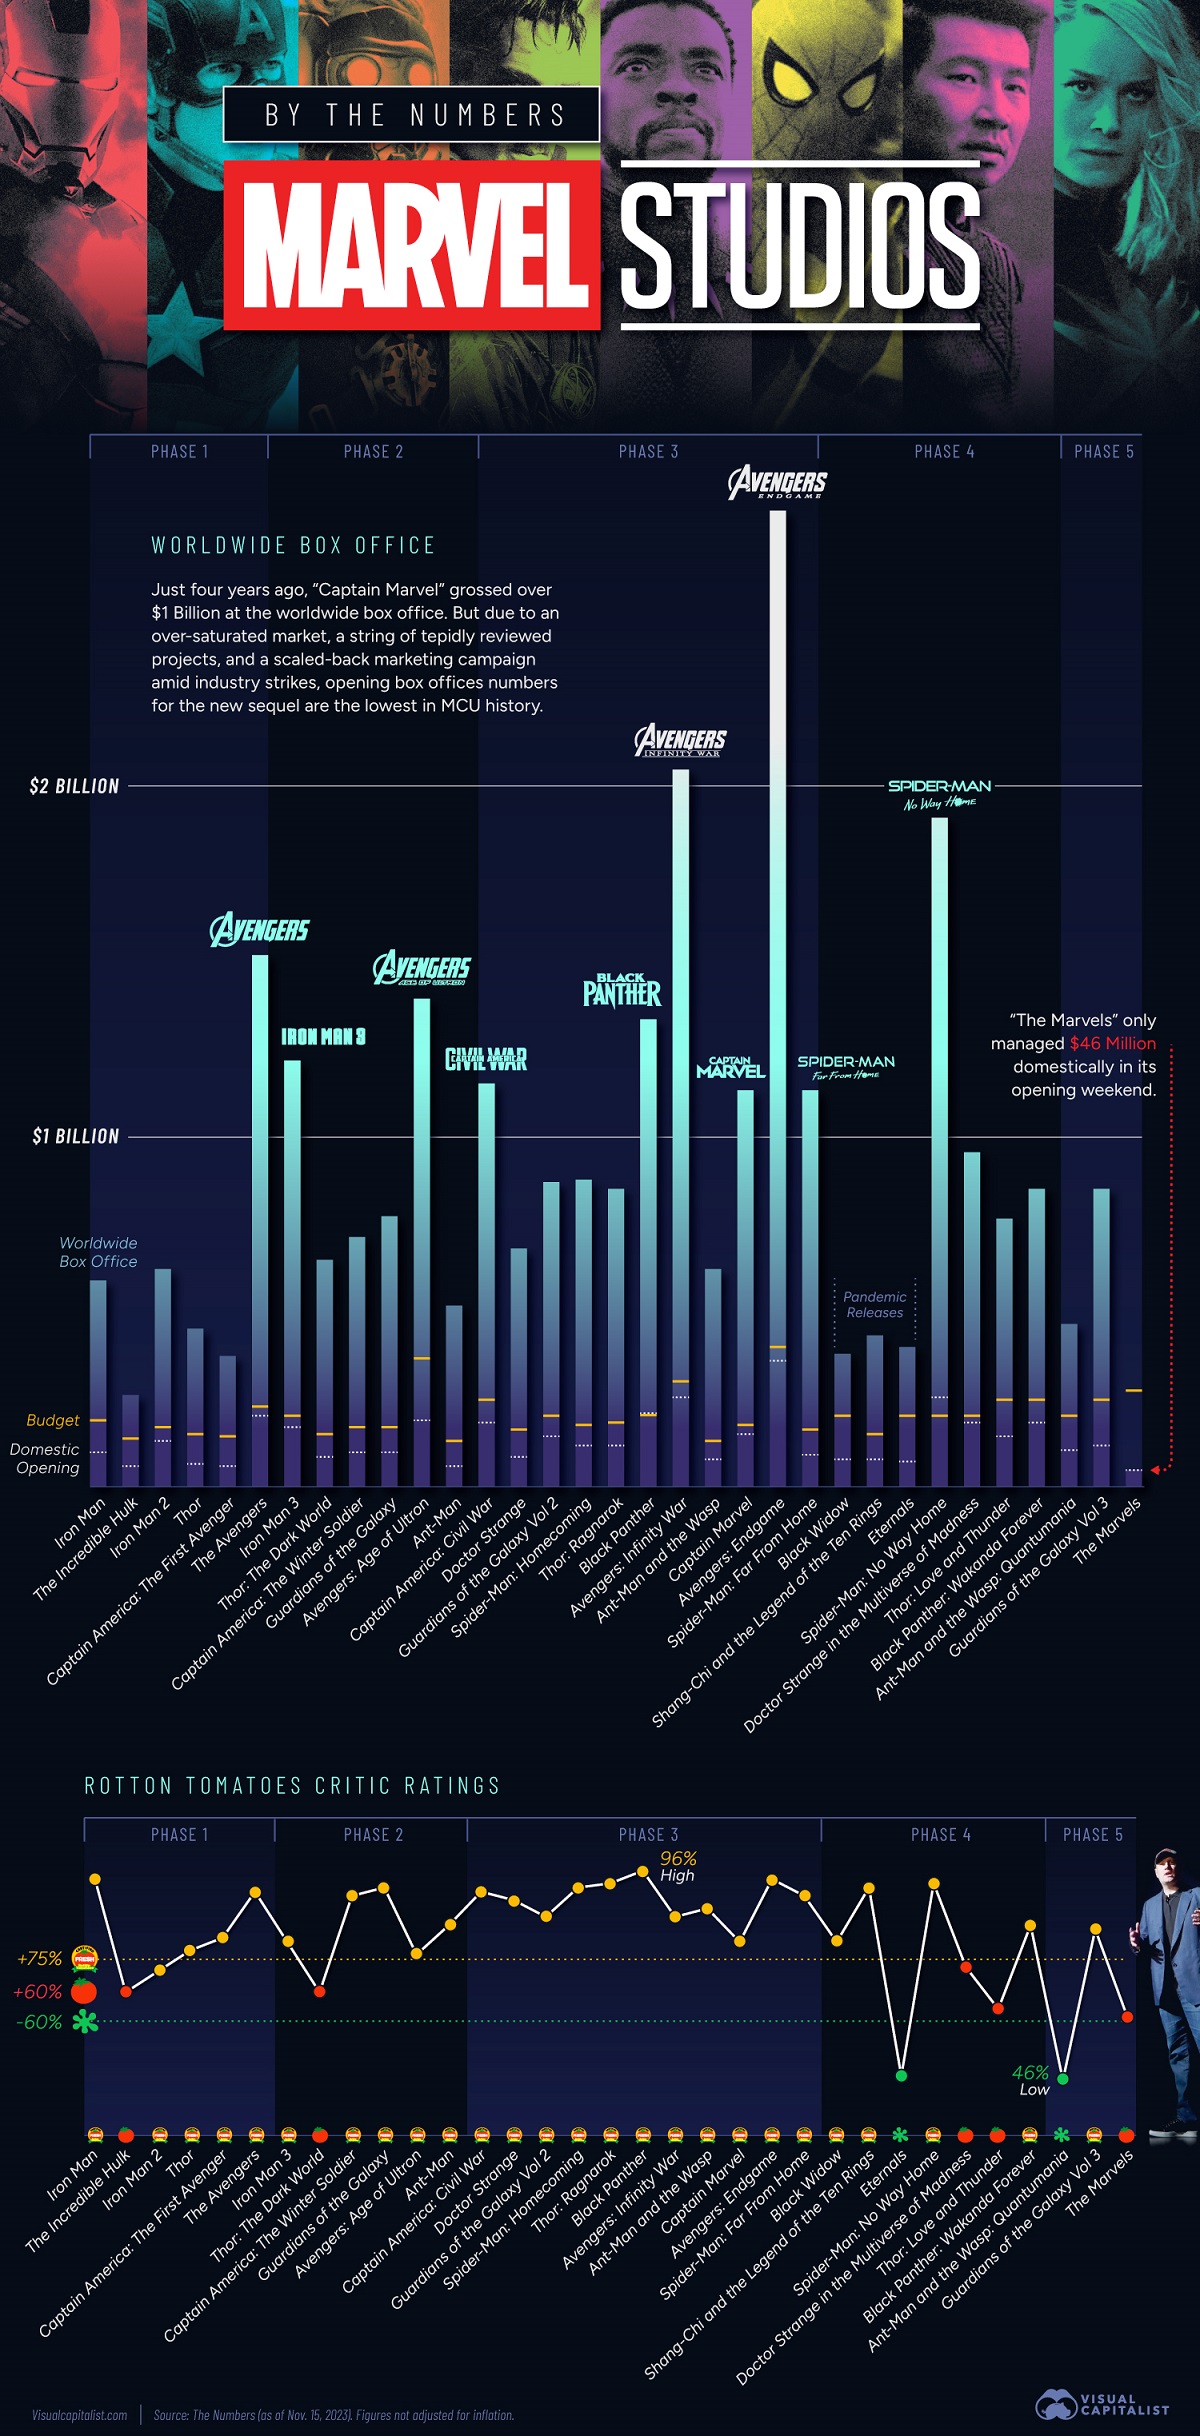
Disney’s investment in Marvel Entertainment has earned it tens of billions of dollars, but the latest Marvel box office performances are starting to prove worrying.
On November 10, The Marvels released to movie theaters as the 33rd film in the Marvel Cinematic Universe (MCU). After one weekend, it had earned just $46 million domestically, making it the lowest-ever debut for an MCU movie.
This chart shows the rise and fall of Marvel box office earnings using data tracked by The Numbers as of November 12.
Marvel Box Office Earnings (2008‒2023)
The MCU was officially kickstarted with the release of Iron Man in 2008, a well-reviewed hit that earned $585 million worldwide at the box office.
Over the next few years, Marvel has released multiple movies in the same universe, building up characters and stories in “phases” and capitalizing with crossover releases. Phase 1 ended with 2012’s The Avengers—The first Marvel movie to earn more than $1 billion.
Here are Marvel’s movie releases in order of recency, as well as their estimated production budgets, box office hauls, and percentage of positive reviews:
| Release Date | Film | Production Budget | Opening Weekend (Domestic) | Box Office (Worldwide) | Review Score (Rotten Tomatoes) |
|---|---|---|---|---|---|
| Nov. 10, 2023 | The Marvels | $275M | $46M | TBD | 61 |
| May 05, 2023 | Guardians of the Galaxy Vol 3 | $250M | $118M | $845M | 82 |
| Feb. 17, 2023 | Ant-Man and the Wasp: Quantumania | $200M | $106M | $464M | 46 |
| Nov. 11, 2022 | Black Panther: Wakanda Forever | $250M | $181M | $854M | 83 |
| Jul. 08, 2022 | Thor: Love and Thunder | $250M | $144M | $761M | 63 |
| May 06, 2022 | Doctor Strange in the Multiverse of Madness | $200M | $187M | $952M | 73 |
| Dec. 17, 2021 | Spider-Man: No Way Home | $200M | $260M | $1,908M | 93 |
| Nov. 05, 2021 | Eternals | $200M | $71M | $402M | 47 |
| Sep. 03, 2021 | Shang-Chi and the Legend of the Ten Rings | $150M | $75M | $432M | 92 |
| Jul. 09, 2021 | Black Widow | $200M | $80M | $380M | 79 |
| Jul. 02, 2019 | Spider-Man: Far From Home | $160M | $93M | $1,132M | 90 |
| Apr. 26, 2019 | Avengers: Endgame | $400M | $357M | $2,789M | 94 |
| Mar. 08, 2019 | Captain Marvel | $175M | $153M | $1,130M | 79 |
| Jul. 06, 2018 | Ant-Man and the Wasp | $130M | $76M | $623M | 87 |
| Apr. 27, 2018 | Avengers: Infinity War | $300M | $258M | $2,048M | 85 |
| Feb. 16, 2018 | Black Panther | $200M | $202M | $1,336M | 96 |
| Nov. 03, 2017 | Thor: Ragnarok | $180M | $123M | $850M | 93 |
| Jul. 07, 2017 | Spider-Man: Homecoming | $175M | $117M | $878M | 92 |
| May 05, 2017 | Guardians of the Galaxy Vol 2 | $200M | $147M | $869M | 85 |
| Nov. 04, 2016 | Doctor Strange | $165M | $85M | $676M | 89 |
| May 06, 2016 | Captain America: Civil War | $250M | $179M | $1,152M | 91 |
| Jul. 17, 2015 | Ant-Man | $130M | $57M | $519M | 83 |
| May 01, 2015 | Avengers: Age of Ultron | $365M | $191M | $1,395M | 76 |
| Aug. 01, 2014 | Guardians of the Galaxy | $170M | $94M | $771M | 92 |
| Apr. 04, 2014 | Captain America: The Winter Soldier | $170M | $95M | $714M | 90 |
| Nov. 08, 2013 | Thor: The Dark World | $150M | $86M | $645M | 67 |
| May 03, 2013 | Iron Man 3 | $200M | $174M | $1,215M | 79 |
| May 04, 2012 | The Avengers | $225M | $207M | $1,515M | 91 |
| Jul. 22, 2011 | Captain America: The First Avenger | $140M | $65M | $371M | 80 |
| May 06, 2011 | Thor | $150M | $66M | $449M | 77 |
| May 07, 2010 | Iron Man 2 | $170M | $128M | $621M | 72 |
| Jun. 13, 2008 | The Incredible Hulk | $138M | $55M | $266M | 67 |
| May 02, 2008 | Iron Man | $186M | $102M | $585M | 94 |
| Median | $193M | $118M | $808M | 83 |
Throughout the years, Marvel’s movie releases garnered greater box office draws and critical praise, culminating in Avengers: Endgame earning $2.79 billion at the box office and becoming one of the highest grossing movies of all time.
But subsequent releases have been hampered, first by the COVID-19 pandemic and then by a mix of poor reviews, scaled-back marketing campaigns, and oversaturation. While the first three phases of the MCU were limited only to Marvel’s feature film releases, Phase Four (2021‒2022) included eight television shows released on Disney+.
The Marvels, the sequel to the billion-dollar-grossing Captain Marvel and the Disney+ show Ms. Marvel, is the third movie in Phase Five. The phase was planned to span five movies and seven television shows, but Marvel’s recent underperformance and production delays from labor strikes in Hollywood are already causing Disney to re-evaluate its release plans.
Will Marvel be able to climb back into pole position at the global box office?


Markets
The European Stock Market: Attractive Valuations Offer Opportunities
On average, the European stock market has valuations that are nearly 50% lower than U.S. valuations. But how can you access the market?


European Stock Market: Attractive Valuations Offer Opportunities
Europe is known for some established brands, from L’Oréal to Louis Vuitton. However, the European stock market offers additional opportunities that may be lesser known.
The above infographic, sponsored by STOXX, outlines why investors may want to consider European stocks.
Attractive Valuations
Compared to most North American and Asian markets, European stocks offer lower or comparable valuations.
| Index | Price-to-Earnings Ratio | Price-to-Book Ratio |
|---|---|---|
| EURO STOXX 50 | 14.9 | 2.2 |
| STOXX Europe 600 | 14.4 | 2 |
| U.S. | 25.9 | 4.7 |
| Canada | 16.1 | 1.8 |
| Japan | 15.4 | 1.6 |
| Asia Pacific ex. China | 17.1 | 1.8 |
Data as of February 29, 2024. See graphic for full index names. Ratios based on trailing 12 month financials. The price to earnings ratio excludes companies with negative earnings.
On average, European valuations are nearly 50% lower than U.S. valuations, potentially offering an affordable entry point for investors.
Research also shows that lower price ratios have historically led to higher long-term returns.
Market Movements Not Closely Connected
Over the last decade, the European stock market had low-to-moderate correlation with North American and Asian equities.
The below chart shows correlations from February 2014 to February 2024. A value closer to zero indicates low correlation, while a value of one would indicate that two regions are moving in perfect unison.
| EURO STOXX 50 | STOXX EUROPE 600 | U.S. | Canada | Japan | Asia Pacific ex. China |
|
|---|---|---|---|---|---|---|
| EURO STOXX 50 | 1.00 | 0.97 | 0.55 | 0.67 | 0.24 | 0.43 |
| STOXX EUROPE 600 | 1.00 | 0.56 | 0.71 | 0.28 | 0.48 | |
| U.S. | 1.00 | 0.73 | 0.12 | 0.25 | ||
| Canada | 1.00 | 0.22 | 0.40 | |||
| Japan | 1.00 | 0.88 | ||||
| Asia Pacific ex. China | 1.00 |
Data is based on daily USD returns.
European equities had relatively independent market movements from North American and Asian markets. One contributing factor could be the differing sector weights in each market. For instance, technology makes up a quarter of the U.S. market, but health care and industrials dominate the broader European market.
Ultimately, European equities can enhance portfolio diversification and have the potential to mitigate risk for investors.
Tracking the Market
For investors interested in European equities, STOXX offers a variety of flagship indices:
| Index | Description | Market Cap |
|---|---|---|
| STOXX Europe 600 | Pan-regional, broad market | €10.5T |
| STOXX Developed Europe | Pan-regional, broad-market | €9.9T |
| STOXX Europe 600 ESG-X | Pan-regional, broad market, sustainability focus | €9.7T |
| STOXX Europe 50 | Pan-regional, blue-chip | €5.1T |
| EURO STOXX 50 | Eurozone, blue-chip | €3.5T |
Data is as of February 29, 2024. Market cap is free float, which represents the shares that are readily available for public trading on stock exchanges.
The EURO STOXX 50 tracks the Eurozone’s biggest and most traded companies. It also underlies one of the world’s largest ranges of ETFs and mutual funds. As of November 2023, there were €27.3 billion in ETFs and €23.5B in mutual fund assets under management tracking the index.
“For the past 25 years, the EURO STOXX 50 has served as an accurate, reliable and tradable representation of the Eurozone equity market.”
— Axel Lomholt, General Manager at STOXX
Partnering with STOXX to Track the European Stock Market
Are you interested in European equities? STOXX can be a valuable partner:
- Comprehensive, liquid and investable ecosystem
- European heritage, global reach
- Highly sophisticated customization capabilities
- Open architecture approach to using data
- Close partnerships with clients
- Part of ISS STOXX and Deutsche Börse Group
With a full suite of indices, STOXX can help you benchmark against the European stock market.
Learn how STOXX’s European indices offer liquid and effective market access.

-

 Economy3 days ago
Economic Growth Forecasts for G7 and BRICS Countries in 2024
The IMF has released its economic growth forecasts for 2024. How do the G7 and BRICS countries compare?
-

 Markets2 weeks ago
U.S. Debt Interest Payments Reach $1 Trillion
U.S. debt interest payments have surged past the $1 trillion dollar mark, amid high interest rates and an ever-expanding debt burden.
-

 United States2 weeks ago
Ranked: The Largest U.S. Corporations by Number of Employees
We visualized the top U.S. companies by employees, revealing the massive scale of retailers like Walmart, Target, and Home Depot.
-

 Markets2 weeks ago
The Top 10 States by Real GDP Growth in 2023
This graphic shows the states with the highest real GDP growth rate in 2023, largely propelled by the oil and gas boom.
-

 Markets3 weeks ago
Ranked: The World’s Top Flight Routes, by Revenue
In this graphic, we show the highest earning flight routes globally as air travel continued to rebound in 2023.
-

 Markets3 weeks ago
Ranked: The Most Valuable Housing Markets in America
The U.S. residential real estate market is worth a staggering $47.5 trillion. Here are the most valuable housing markets in the country.


-

 Debt1 week ago
How Debt-to-GDP Ratios Have Changed Since 2000
-

 Countries2 weeks ago
Population Projections: The World’s 6 Largest Countries in 2075
-
Markets2 weeks ago
The Top 10 States by Real GDP Growth in 2023
-

 Demographics2 weeks ago
The Smallest Gender Wage Gaps in OECD Countries
-

 United States2 weeks ago
Where U.S. Inflation Hit the Hardest in March 2024
-

 Green2 weeks ago
Top Countries By Forest Growth Since 2001
-
United States2 weeks ago
Ranked: The Largest U.S. Corporations by Number of Employees
-

 Maps2 weeks ago
The Largest Earthquakes in the New York Area (1970-2024)