Misc
Mapped: The 50-Year Evolution of Walt Disney World

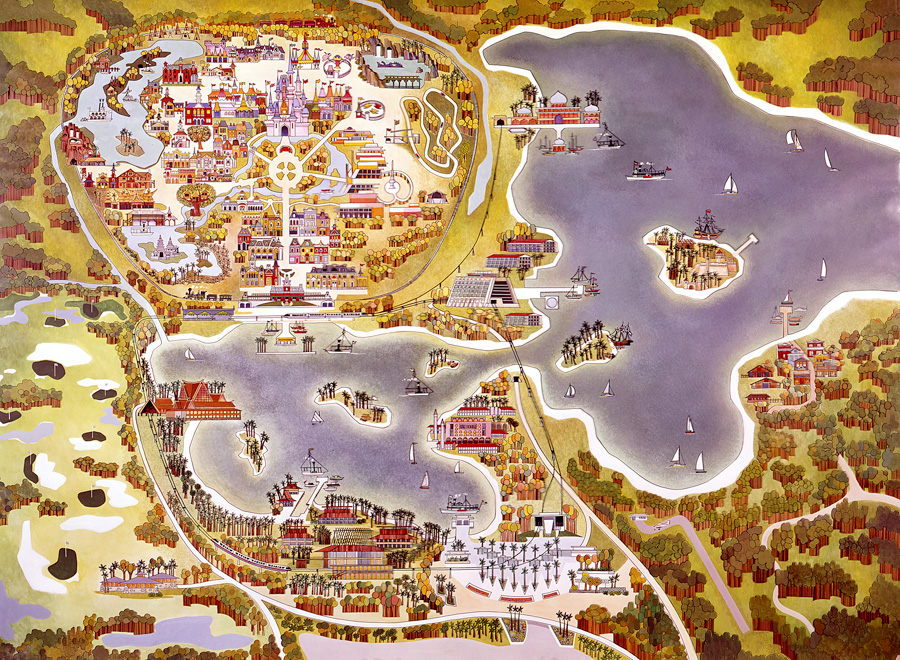
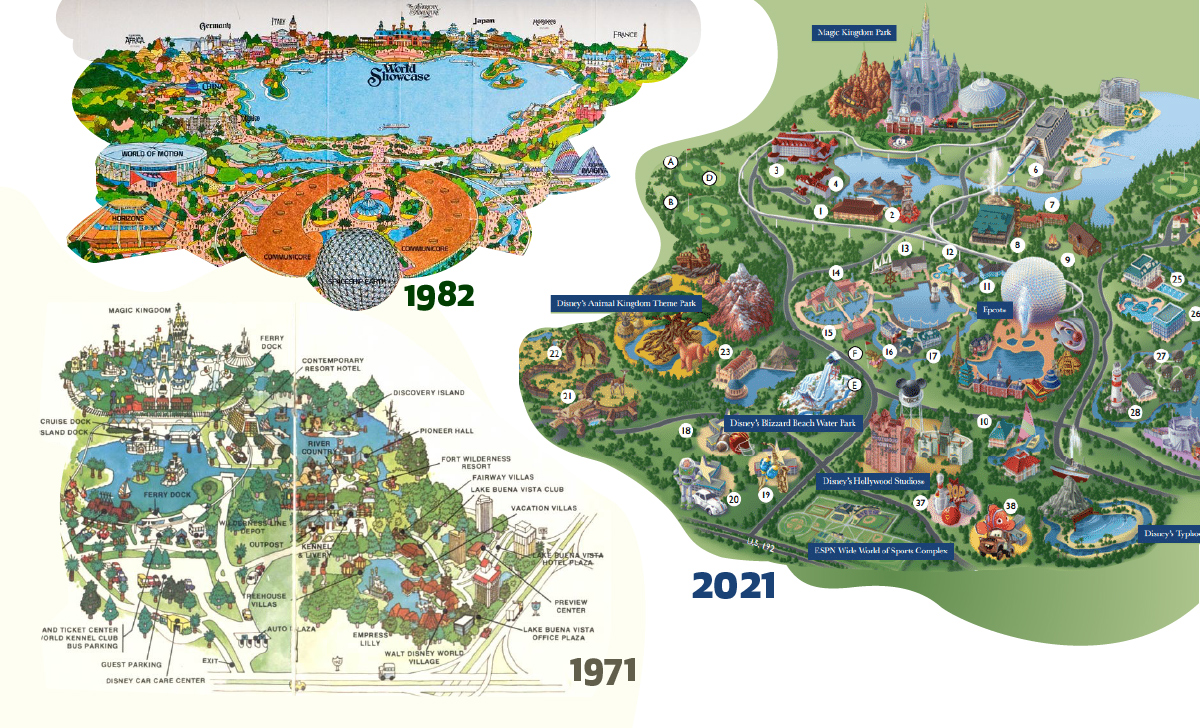
Walt Disney World Master Plan (circa 1982) with the Magic Kingdom in the top–left and Epcot under construction in the center.
The 50-Year Evolution of Walt Disney World in Maps
In the early 1960s, Walt Disney was riding high on the success of Disneyland in California.
Disneyland had a problem though. Only a small fraction of its guests were from the East Coast of the U.S., which meant Disney was missing out on a huge potential audience for his theme park. To expand the company’s reach and scope, he began looking for a location that would match his grand ambitions, and Florida, with its abundance of cheap land and warm climate was a natural choice.
On November 22, 1963—coincidentally the day JFK was assassinated—Walt flew over to the Orlando to do some location scouting. At the time, most of the area was swampland, though there was one area adjacent to an under-construction highway that caught his attention.
Using shell companies to preserve his anonymity (and to keep the price down), Disney began acquiring the sprawling properties that would become today’s Walt Disney World (WDW).
Walt Disney World: The First Iteration
When Walt Disney World finally opened in 1971, it included the main Magic Kingdom site, as well as two golf courses and two hotels—Contemporary Resort and the Polynesian Village Resort. These areas were all connected by a monorail system.
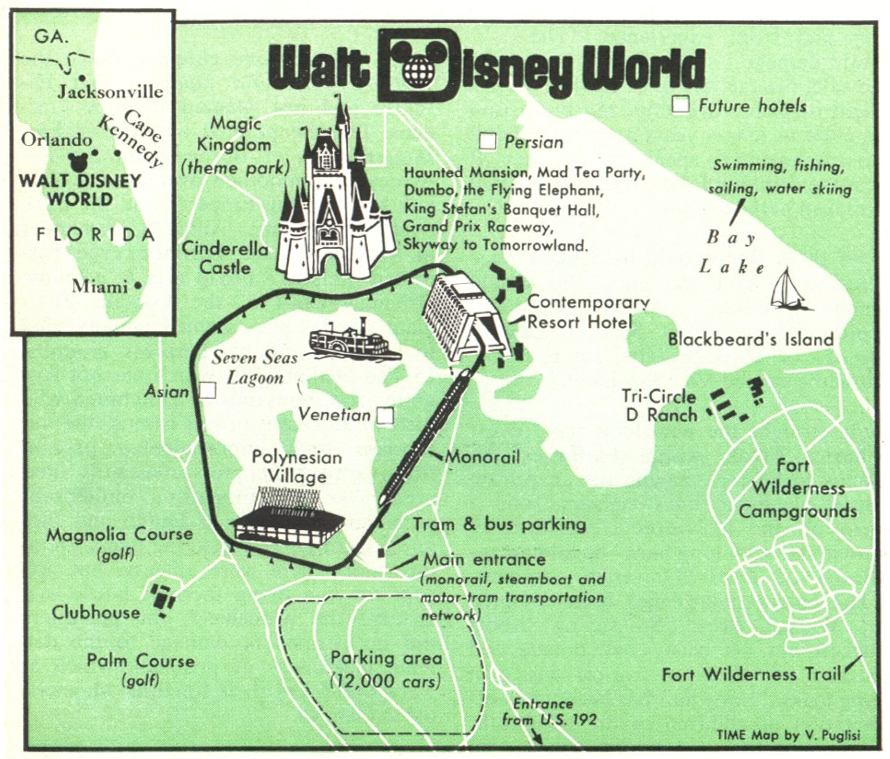
As these maps depict, there was a plan to develop three unique themed zones around the Seven Seas Lagoon: Persian, Asian, and Venetian.
However, these projects were scrapped after the 1973 oil crisis as tourism declined.
The original master plan for Walt Disney World did not include plans for the Seven Seas Lagoon, and it was likely added so that the displaced earth could be used to fortify swampy sections of the property to make them suitable for building.
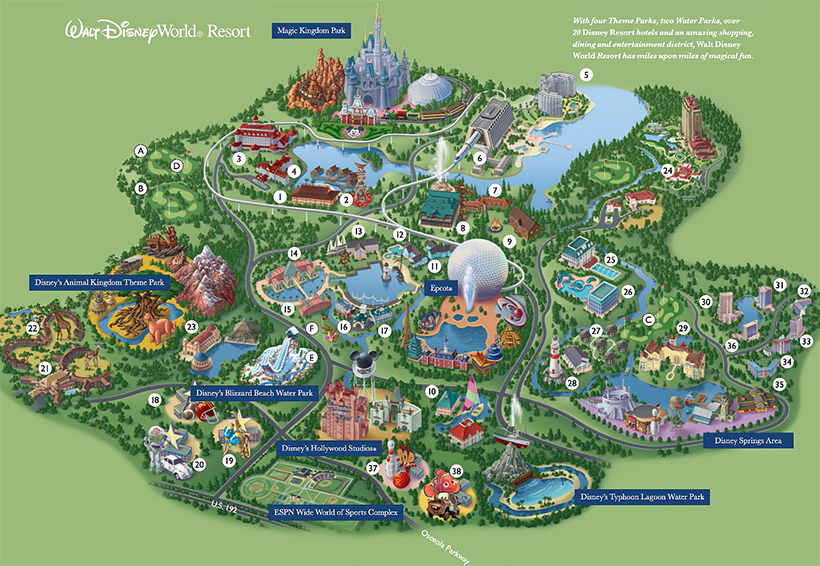
Epcot Expansion
The first major Disney World expansion was Epcot Center, which opened in 1982. The site, which was twice as big as the Magic Kingdom, is best described as a permanent world’s fair.
The park was anchored by Future World and “Spaceship Earth”, the iconic geodesic sphere structure that sat at the entrance of the park.
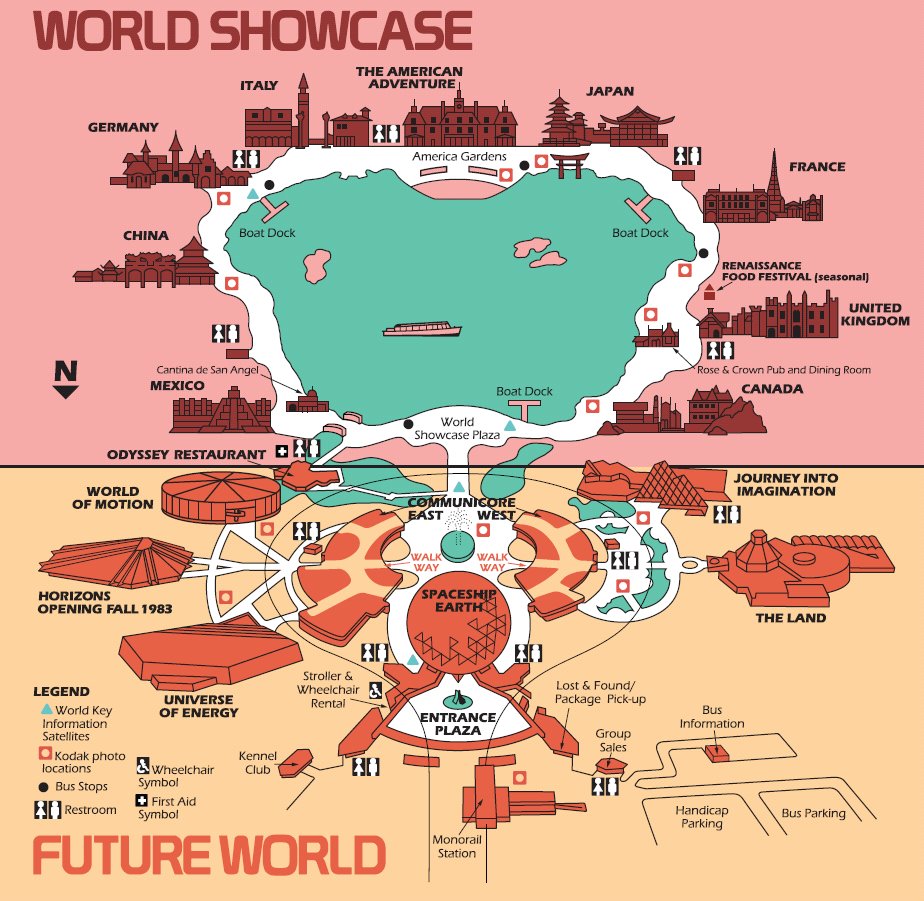
Surrounding the nearby lake were pavilions themed after various locations in the world.
Though the scope of Epcot was impressive at the time, it was still vastly scaled down from Walt Disney’s original vision for a fully functioning “city of the future”. Ultimately, the company was uncertain about the feasibility of operating a functional city, so the idea was scrapped in favor of the current iteration.
Hollywood Comes to Florida
Disney-MGM Studios opened in 1989, in a location just south of Epcot. The park featured “imagined worlds from film, television, music, and theater, drawing inspiration from the Golden Age of Hollywood”.
To make this happen, Disney entered into a licensing agreement with MGM to help increase the variety of film representation within the park.
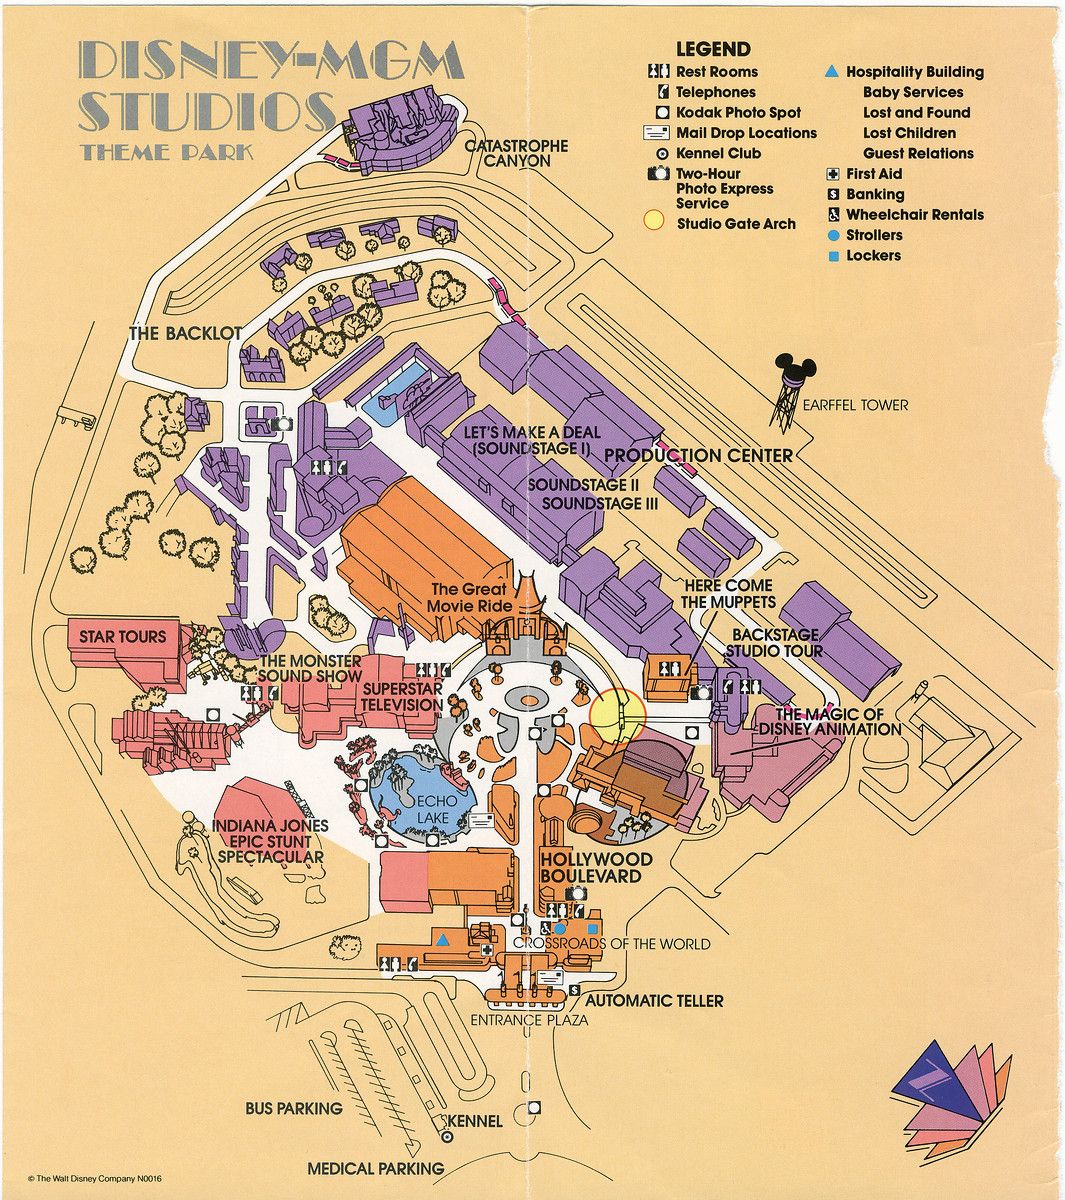
Approximately 11 million visitors pass through Hollywood Studios every year.
Animal Kingdom and Rapid Expansion
In 1998, WDW added a fourth theme park called Animal Kingdom. It’s the largest theme park in the world, covering 580 acres, and combines elements of both a zoo and theme park.
A central feature of Animal Kingdom is the massive Tree of Life. The 145 foot tall work of art contains 325 unique animal carvings and over 100,000 artificial leaves. The park itself features about 2,000 animals representing 300 species.
Around 13 million people visit the theme park each year.
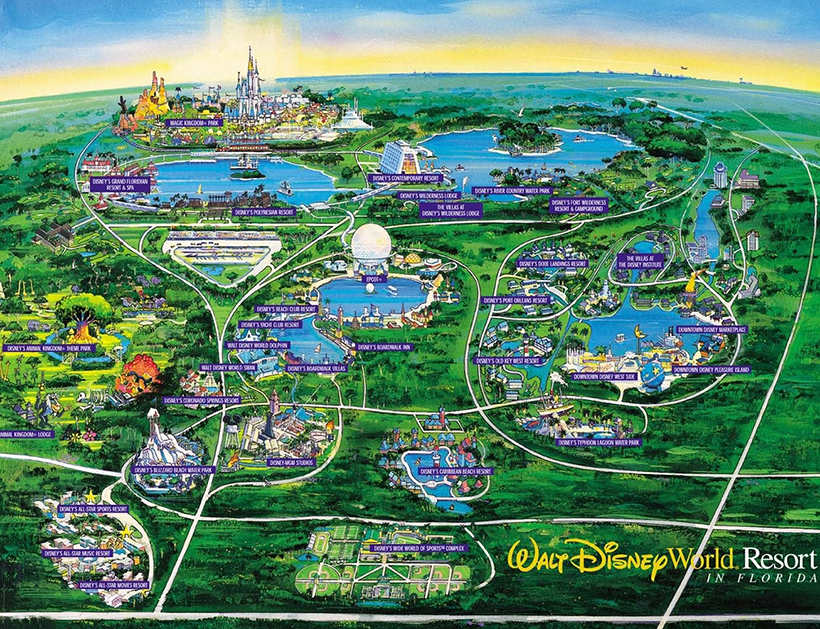
Walt Disney World Today
So, how big is Walt Disney World today? 43 square miles, which is about the same area as San Francisco and and twice the size of Manhattan.
The scale of today’s WDW has fully eclipsed the original version of the site. The resort, which featured two hotels in 1971, now has more than 20, with 30,000 hotel rooms. WDW is also the largest single site employer in the United States.
Looking at the map above, one might wonder whether this sprawling entertainment empire is bursting at the seams. Will WDW eventually build over its entire property? The answer is somewhat complicated.
What’s Missing from Walt Disney World Maps?
While the stylized maps above do a great job of highlighting WDW’s many attractions, they generally downplay an important fact. Much of the land owned by Disney is still undeveloped, and there is a lot of space between the various parks. Much of this space is earmarked as conservation areas, and only some of the remaining land is actually suitable for development. Despite the sheer size of the property occupied by WDW, space for expansion grows increasingly scarce with each new development.
The stylized maps also downplay the size of WDW’s parking lots, which are extensive. The Magic Kingdom parking lot, for example, is actually larger than the theme park itself.
The giant map below is an accurate representation of the park’s layout, and includes facts on some of the attributes of the park.
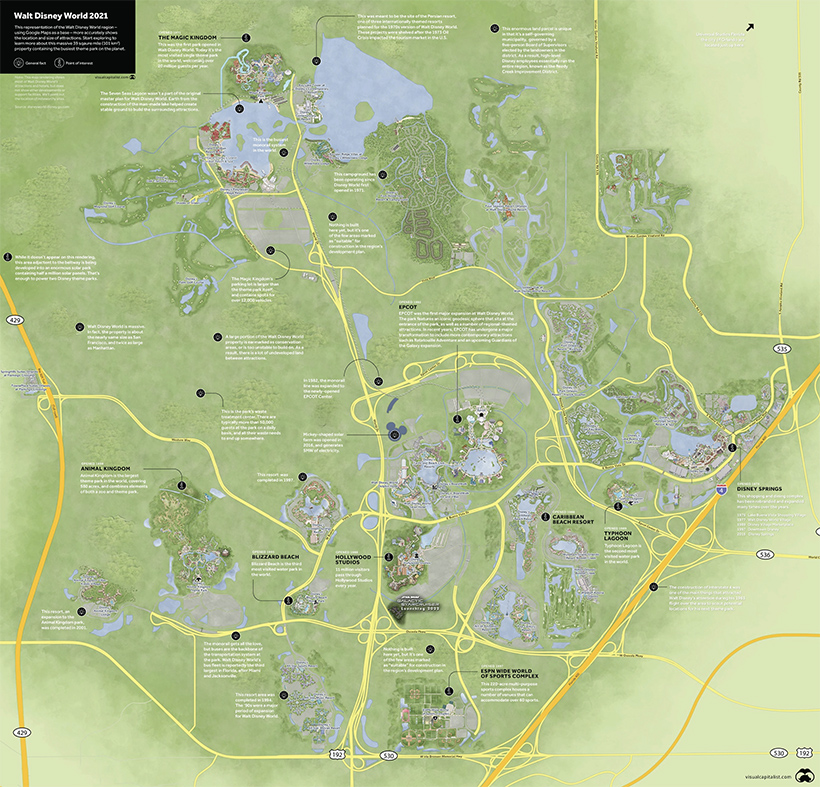
This enormous land parcel is also unique in that it’s a kind of self-governing municipality, with its own fire department and emergency services. The district—officially known as the Reedy Creek Improvement District—is governed by a five-person Board of Supervisors elected by the landowners in the district. As a result, high-level Disney employees essentially run the entire region encompassing WDW.
In the 50 years since the Magic Kingdom first opened its turnstiles, Disney’s own kingdom in Central Florida has transformed dramatically. With Disney’s continued financial success and the freedom to make large-scale moves within their property, the next 50 years will no doubt bring more dramatic changes to the world’s biggest theme park.


VC+
VC+: Get Our Key Takeaways From the IMF’s World Economic Outlook
A sneak preview of the exclusive VC+ Special Dispatch—your shortcut to understanding IMF’s World Economic Outlook report.

Have you read IMF’s latest World Economic Outlook yet? At a daunting 202 pages, we don’t blame you if it’s still on your to-do list.
But don’t worry, you don’t need to read the whole April release, because we’ve already done the hard work for you.
To save you time and effort, the Visual Capitalist team has compiled a visual analysis of everything you need to know from the report—and our VC+ Special Dispatch is available exclusively to VC+ members. All you need to do is log into the VC+ Archive.
If you’re not already subscribed to VC+, make sure you sign up now to access the full analysis of the IMF report, and more (we release similar deep dives every week).
For now, here’s what VC+ members get to see.
Your Shortcut to Understanding IMF’s World Economic Outlook
With long and short-term growth prospects declining for many countries around the world, this Special Dispatch offers a visual analysis of the key figures and takeaways from the IMF’s report including:
- The global decline in economic growth forecasts
- Real GDP growth and inflation forecasts for major nations in 2024
- When interest rate cuts will happen and interest rate forecasts
- How debt-to-GDP ratios have changed since 2000
- And much more!

Get the Full Breakdown in the Next VC+ Special Dispatch
VC+ members can access the full Special Dispatch by logging into the VC+ Archive, where you can also check out previous releases.
Make sure you join VC+ now to see exclusive charts and the full analysis of key takeaways from IMF’s World Economic Outlook.
Don’t miss out. Become a VC+ member today.
What You Get When You Become a VC+ Member
VC+ is Visual Capitalist’s premium subscription. As a member, you’ll get the following:
- Special Dispatches: Deep dive visual briefings on crucial reports and global trends
- Markets This Month: A snappy summary of the state of the markets and what to look out for
- The Trendline: Weekly curation of the best visualizations from across the globe
- Global Forecast Series: Our flagship annual report that covers everything you need to know related to the economy, markets, geopolitics, and the latest tech trends
- VC+ Archive: Hundreds of previously released VC+ briefings and reports that you’ve been missing out on, all in one dedicated hub
You can get all of the above, and more, by joining VC+ today.

-

 Mining1 week ago
Gold vs. S&P 500: Which Has Grown More Over Five Years?
-

 Markets2 weeks ago
Ranked: The Most Valuable Housing Markets in America
-

 Money2 weeks ago
Which States Have the Highest Minimum Wage in America?
-

 AI2 weeks ago
Ranked: Semiconductor Companies by Industry Revenue Share
-

 Markets2 weeks ago
Ranked: The World’s Top Flight Routes, by Revenue
-

 Countries2 weeks ago
Population Projections: The World’s 6 Largest Countries in 2075
-

 Markets2 weeks ago
The Top 10 States by Real GDP Growth in 2023
-

 Demographics2 weeks ago
The Smallest Gender Wage Gaps in OECD Countries