Markets
U.S. Debt Interest Payments Reach $1 Trillion
![]() See this visualization first on the Voronoi app.
See this visualization first on the Voronoi app.

U.S. Debt Interest Payments Reach $1 Trillion
This was originally posted on our Voronoi app. Download the app for free on iOS or Android and discover incredible data-driven charts from a variety of trusted sources.
The cost of paying for America’s national debt crossed the $1 trillion dollar mark in 2023, driven by high interest rates and a record $34 trillion mountain of debt.
Over the last decade, U.S. debt interest payments have more than doubled amid vast government spending during the pandemic crisis. As debt payments continue to soar, the Congressional Budget Office (CBO) reported that debt servicing costs surpassed defense spending for the first time ever this year.
This graphic shows the sharp rise in U.S. debt payments, based on data from the Federal Reserve.
A $1 Trillion Interest Bill, and Growing
Below, we show how U.S. debt interest payments have risen at a faster pace than at another time in modern history:
| Date | Interest Payments | U.S. National Debt |
|---|---|---|
| 2023 | $1.0T | $34.0T |
| 2022 | $830B | $31.4T |
| 2021 | $612B | $29.6T |
| 2020 | $518B | $27.7T |
| 2019 | $564B | $23.2T |
| 2018 | $571B | $22.0T |
| 2017 | $493B | $20.5T |
| 2016 | $460B | $20.0T |
| 2015 | $435B | $18.9T |
| 2014 | $442B | $18.1T |
| 2013 | $425B | $17.2T |
| 2012 | $417B | $16.4T |
| 2011 | $433B | $15.2T |
| 2010 | $400B | $14.0T |
| 2009 | $354B | $12.3T |
| 2008 | $380B | $10.7T |
| 2007 | $414B | $9.2T |
| 2006 | $387B | $8.7T |
| 2005 | $355B | $8.2T |
| 2004 | $318B | $7.6T |
| 2003 | $294B | $7.0T |
| 2002 | $298B | $6.4T |
| 2001 | $318B | $5.9T |
| 2000 | $353B | $5.7T |
| 1999 | $353B | $5.8T |
| 1998 | $360B | $5.6T |
| 1997 | $368B | $5.5T |
| 1996 | $362B | $5.3T |
| 1995 | $357B | $5.0T |
| 1994 | $334B | $4.8T |
| 1993 | $311B | $4.5T |
| 1992 | $306B | $4.2T |
| 1991 | $308B | $3.8T |
| 1990 | $298B | $3.4T |
| 1989 | $275B | $3.0T |
| 1988 | $254B | $2.7T |
| 1987 | $240B | $2.4T |
| 1986 | $225B | $2.2T |
| 1985 | $219B | $1.9T |
| 1984 | $205B | $1.7T |
| 1983 | $176B | $1.4T |
| 1982 | $157B | $1.2T |
| 1981 | $142B | $1.0T |
| 1980 | $113B | $930.2B |
| 1979 | $96B | $845.1B |
| 1978 | $84B | $789.2B |
| 1977 | $69B | $718.9B |
| 1976 | $61B | $653.5B |
| 1975 | $55B | $576.6B |
| 1974 | $50B | $492.7B |
| 1973 | $45B | $469.1B |
| 1972 | $39B | $448.5B |
| 1971 | $36B | $424.1B |
| 1970 | $35B | $389.2B |
| 1969 | $30B | $368.2B |
| 1968 | $25B | $358.0B |
| 1967 | $23B | $344.7B |
| 1966 | $21B | $329.3B |
Interest payments represent seasonally adjusted annual rate at the end of Q4.
At current rates, the U.S. national debt is growing by a remarkable $1 trillion about every 100 days, equal to roughly $3.6 trillion per year.
As the national debt has ballooned, debt payments even exceeded Medicaid outlays in 2023—one of the government’s largest expenditures. On average, the U.S. spent more than $2 billion per day on interest costs last year. Going further, the U.S. government is projected to spend a historic $12.4 trillion on interest payments over the next decade, averaging about $37,100 per American.
Exacerbating matters is that the U.S. is running a steep deficit, which stood at $1.1 trillion for the first six months of fiscal 2024. This has accelerated due to the 43% increase in debt servicing costs along with a $31 billion dollar increase in defense spending from a year earlier. Additionally, a $30 billion increase in funding for the Federal Deposit Insurance Corporation in light of the regional banking crisis last year was a major contributor to the deficit increase.
Overall, the CBO forecasts that roughly 75% of the federal deficit’s increase will be due to interest costs by 2034.


Jobs
The Best U.S. Companies to Work for According to LinkedIn
We visualized the results of a LinkedIn study on the best U.S. companies to work for in 2024.
The Best U.S. Companies to Work for According to LinkedIn
This was originally posted on our Voronoi app. Download the app for free on iOS or Android and discover incredible data-driven charts from a variety of trusted sources.
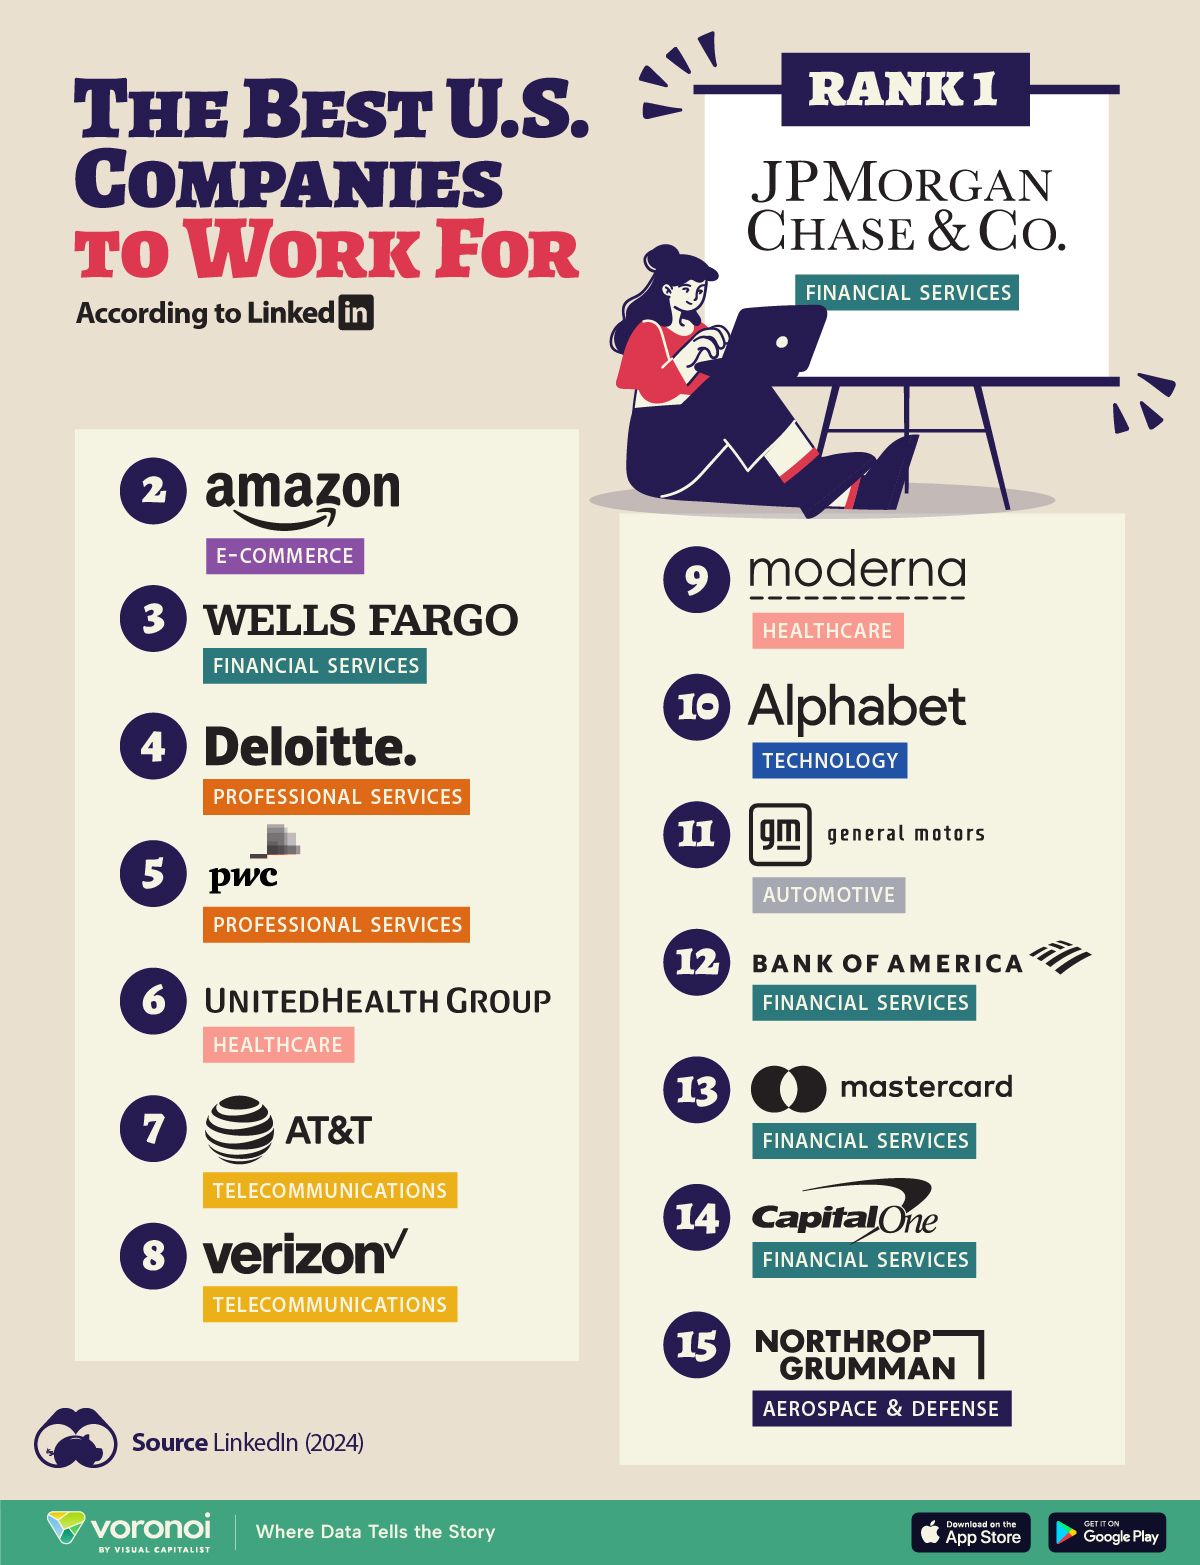
In this graphic, we list the 15 best U.S. companies to work for in 2024, according to LinkedIn data.
LinkedIn ranked companies based on eight pillars: ability to advance, skills growth, company stability, external opportunity, company affinity, gender diversity, educational background, and employee presence in the country.
To be eligible, companies must have had 5,000 or more global employees, with at least 500 in the country as of December 31, 2023.
Data and Highlights
Financial institutions dominate the ranking of the best U.S. companies to work for in 2024, with JP Morgan Chase & Co. ranking first.
| Rank | Company | Industry |
|---|---|---|
| 1 | JP Morgan Chase & Co. | Financial Services |
| 2 | Amazon | E-commerce |
| 3 | Wells Fargo | Financial Services |
| 4 | Deloitte | Professional Services |
| 5 | PwC | Professional Services |
| 6 | UnitedHealth Group | Healthcare |
| 7 | AT&T | Telecommunications |
| 8 | Verizon | Telecommunications |
| 9 | Moderna | Pharmaceuticals |
| 10 | Alphabet Inc. | Technology |
| 11 | General Motors | Automotive |
| 12 | Bank of America | Financial Services |
| 13 | Mastercard | Financial Services |
| 14 | Capital One | Financial Services |
| 15 | Northrop Grumman | Aerospace & Defense |
J.P. Morgan has a program that offers opportunities for candidates without a university degree. In fact, in 2022, 75% of job descriptions at the bank for experienced hires did not require a college degree.
Meanwhile, Deloitte and Amazon offer a variety of free training courses, including in AI.
Moderna includes in its employee package benefits to help avoid employee burnout — from subsidized commuter expenses and pop-up daycare centers, to wellness coaches.
Mastercard offers flexible work availability, with 11.5% remote and 89% hybrid options.
It’s also interesting to note that only Amazon and Alphabet made the cut from the ‘Magnificent Seven’ companies (Apple, Microsoft, Google parent Alphabet, Amazon, Nvidia, Meta Platforms, and Tesla).
See more about the best companies to work for in this infographic, which covers a separate ranking from Glassdoor.

-

 Demographics6 days ago
The Countries That Have Become Sadder Since 2010
-

 Maps2 weeks ago
The Largest Earthquakes in the New York Area (1970-2024)
-

 Green2 weeks ago
Ranked: The Countries With the Most Air Pollution in 2023
-

 Green2 weeks ago
Ranking the Top 15 Countries by Carbon Tax Revenue
-

 Mining2 weeks ago
Gold vs. S&P 500: Which Has Grown More Over Five Years?
-

 Energy2 weeks ago
The World’s Biggest Nuclear Energy Producers
-

 Misc2 weeks ago
How Hard Is It to Get Into an Ivy League School?
-

 Debt2 weeks ago
How Debt-to-GDP Ratios Have Changed Since 2000