Stocks
Charted: S&P 500 Sector Performance in 2023
![]() See this visualization first on the Voronoi app.
See this visualization first on the Voronoi app.
Charted: S&P 500 Sector Performance in 2023
This was originally posted on our Voronoi app. Download the app for free on Apple or Android and discover incredible data-driven charts from a variety of trusted sources.
While the Santa Clause rally of 2023 ultimately ended up fizzling out, the year was still an excellent one for U.S. equities. All three major indices ended December on a positive note, reversing the trend in 2022.
But thematically speaking, which parts of the market did well, and which ones felt the pressure?
We visualize the 2023 performance of individual S&P 500 sectors using data from S&P Global which uses their GICS methodology to differentiate sectors on the index.
Ranked: S&P 500 Sectors by 2023 Return
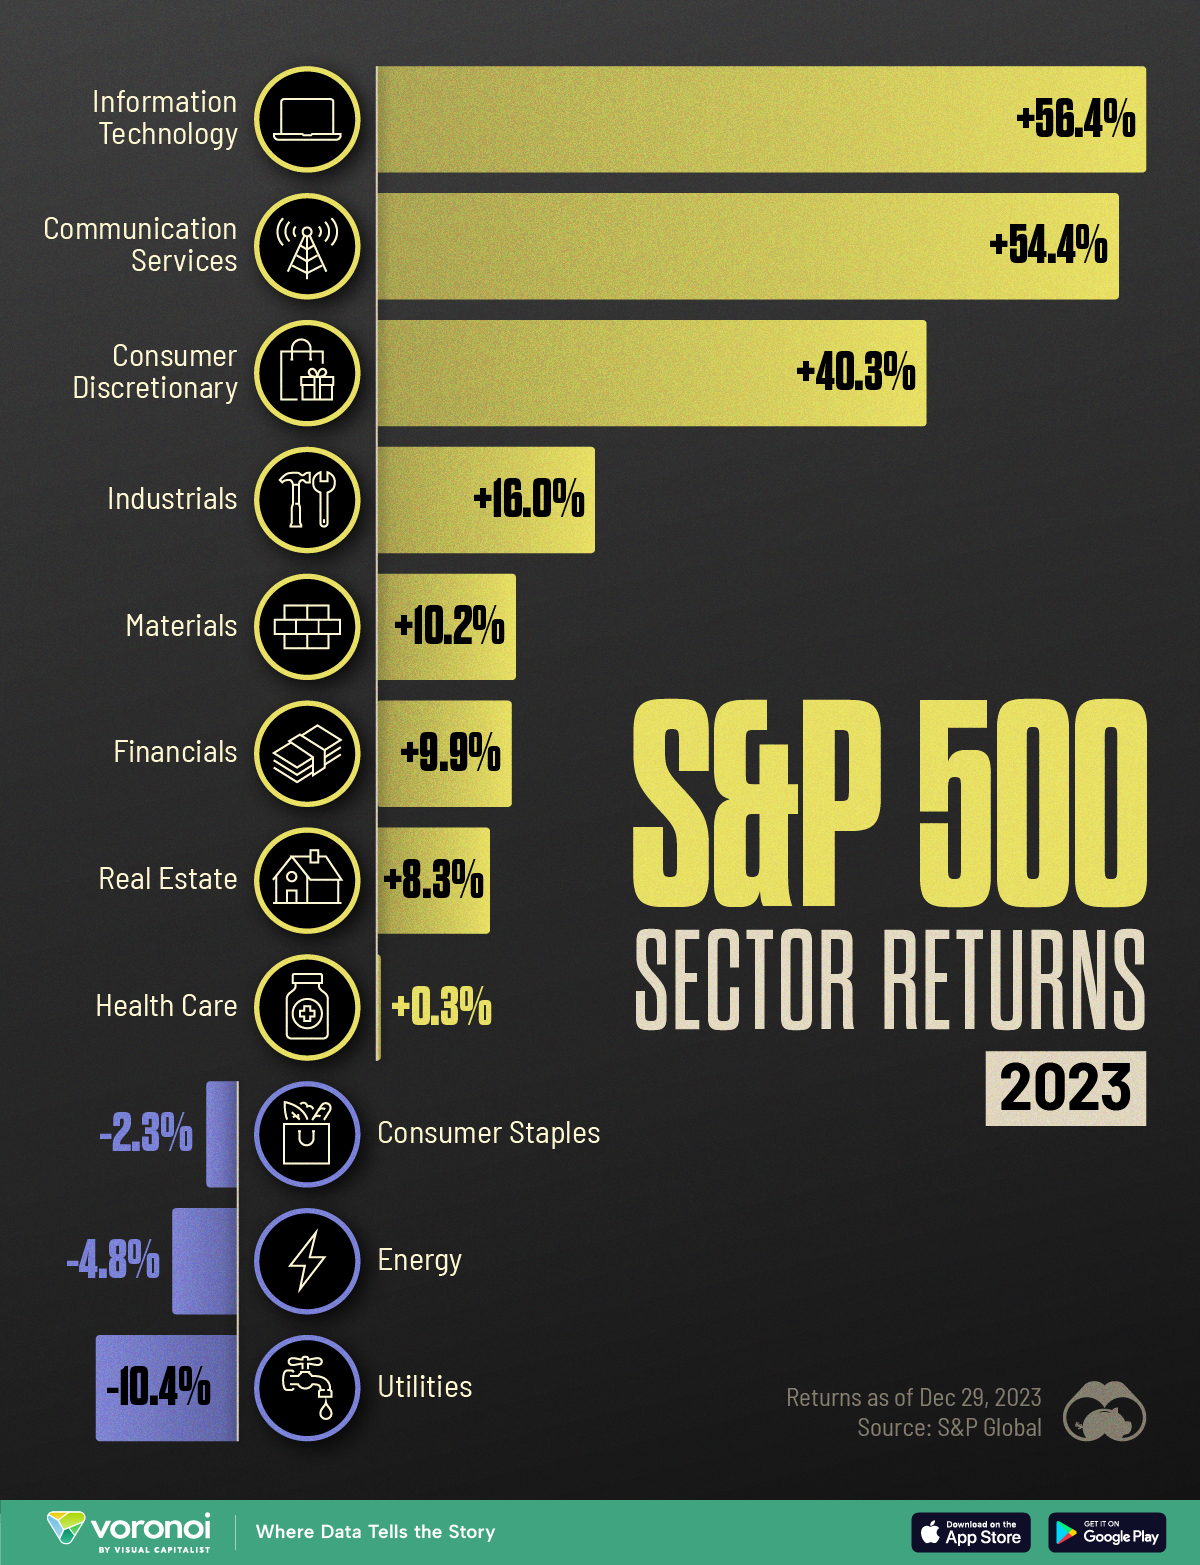
Information Technology, Communication Services, and Consumer Discretionary were the three biggest winners in 2023, all of them up more than 40% for the year.
Here’s a detailed look at how they all did in 2023.
| Rank | S&P Sector | 2023 Return |
|---|---|---|
| 1 | Information Technology | +56.4% |
| 2 | Communication Services | +54.4% |
| 3 | Consumer Discretionary | +40.3% |
| 4 | Industrials | +16.0% |
| 5 | Materials | +10.2% |
| 6 | Financials | +9.9% |
| 7 | Real Estate | +8.3% |
| 8 | Health Care | +0.3% |
| 9 | Consumer Staples | -2.3% |
| 10 | Energy | -4.8% |
| 11 | Utilities | -10.4% |
Note: Data as of December 29, 2023.
Information Technology enjoyed a substantial rally thanks to the AI craze, with stocks like NVIDIA and AMD seeing triple-digit gains.
Other tech bastions, Apple and Microsoft, both with the biggest weights in the index, also gained more than 50% for the year.
Meanwhile, top performers in Communication Services, Meta (+188%), Netflix (+63%), and Alphabet (57%) helped the sector nearly tie for first place.
From a dismal 2022 in particular, Netflix’s crackdown on password-sharing (which led to subscriber growth) and its ad-tier revenue growth has made the streaming service the one to beat in the space—especially since its competitors are still losing money.
Within Consumer Discretionary, big gains by index-heavyweights Amazon and Tesla cemented the sector solidly in third place. Travel companies like Royal Caribbean Cruises, Carnival, and Booking Holdings also saw strong returns.
On the other hand, Consumer Staples, Energy, and Utilities all closed with losses, with the latter suffering from a confluence of factors: dwindling recession fears, high treasury yields, and now-increasing concerns over wildfire exposure.


Markets
Visualizing the Biggest Companies on Major Stock Exchanges
With trillion dollar valuations becoming more common, we’ve compared the five biggest companies by stock exchange.
Comparing the Top Five Companies on Major Stock Exchanges
This was originally posted on our Voronoi app. Download the app for free on iOS or Android and discover incredible data-driven charts from a variety of trusted sources.
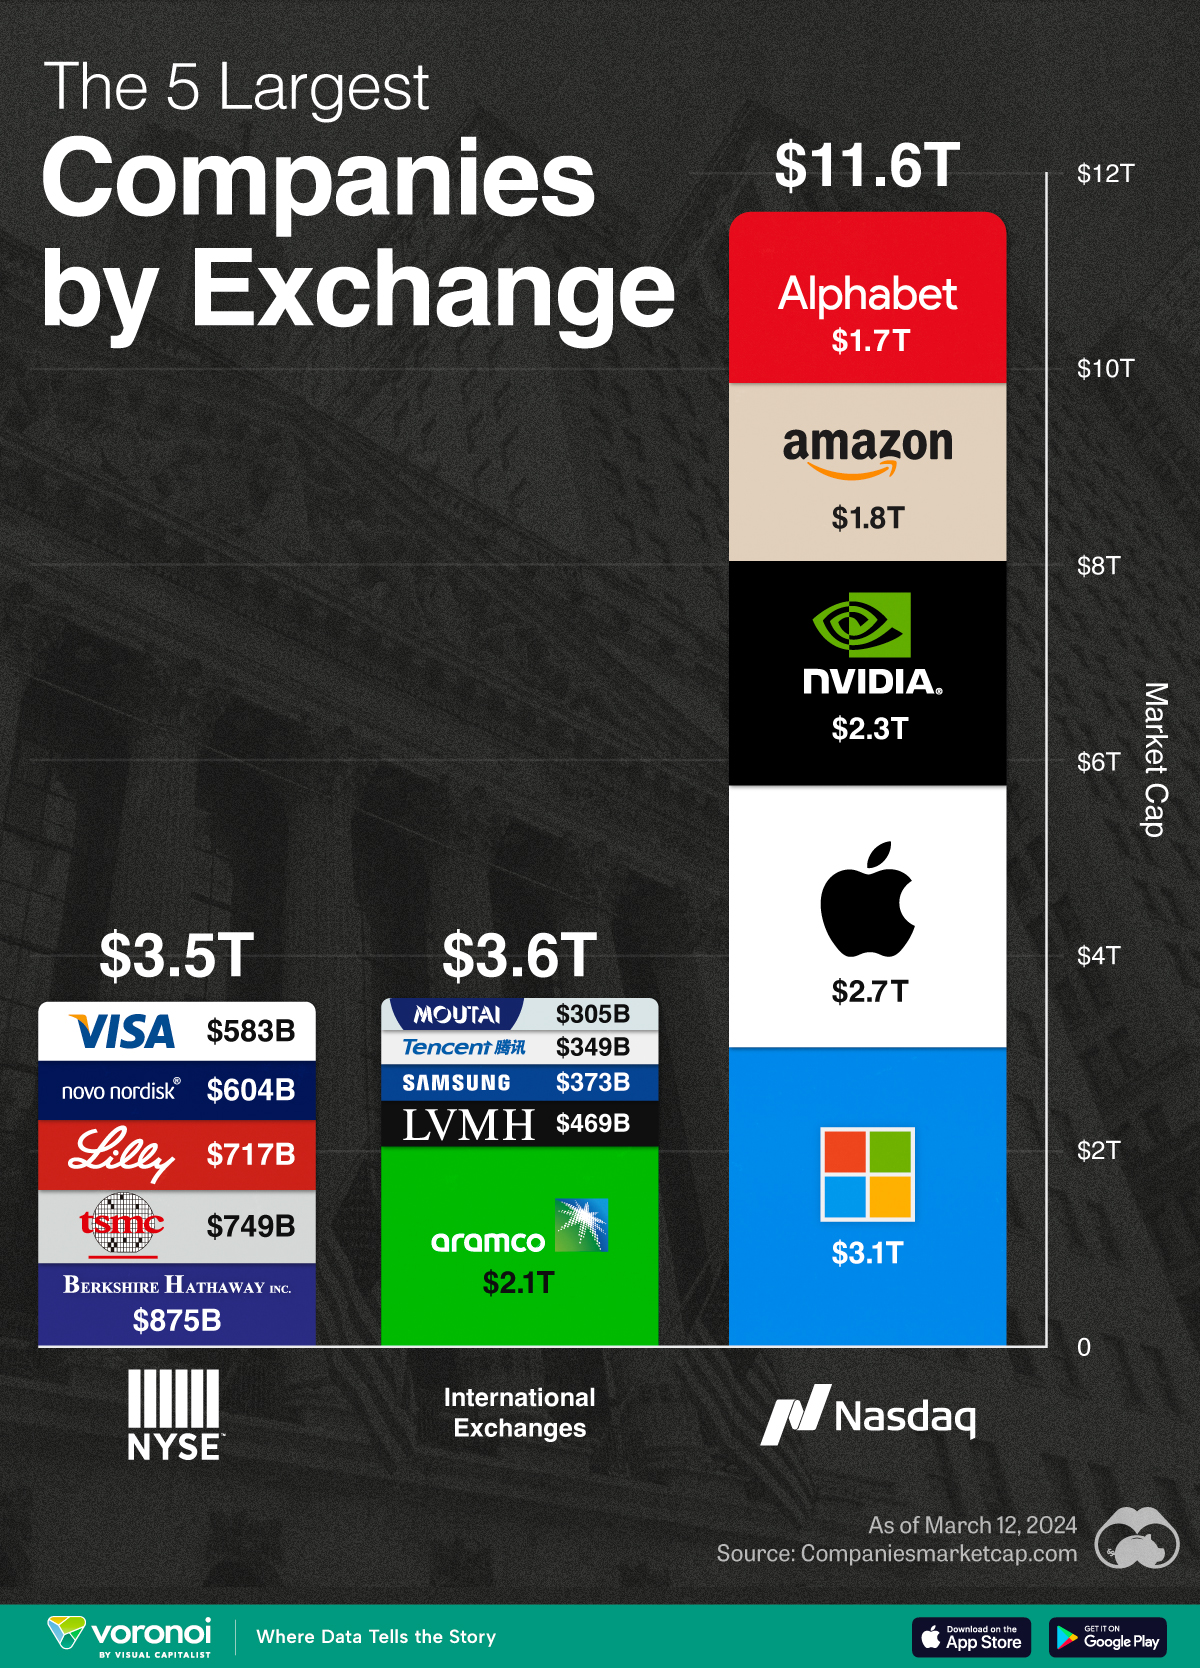
With many companies nearing or surpassing the $1 trillion market capitalization milestone, we’ve put together a graphic that visualizes the five largest companies trading on the Nasdaq, New York Stock Exchange (NYSE), and international exchanges.
These figures come from Companiesmarketcap.com, and are as of March 12, 2024.
Biggest Companies on the Nasdaq
The Nasdaq is largely dominated by the tech industry, with all of its top five companies belonging to the Magnificent Seven group of U.S. tech stocks.
| Company | Market Cap (USD) |
|---|---|
| 🇺🇸 Microsoft | $3.1T |
| 🇺🇸 Apple | $2.7T |
| 🇺🇸 Nvidia | $2.3T |
| 🇺🇸 Amazon | $1.8T |
| $1.7T |
Altogether, these five companies have a combined market capitalization of nearly $12 trillion. To put this figure into context, the entire U.S. equity market is worth around $53 trillion.
Biggest Companies on the NYSE
The NYSE’s largest companies are more diversified, with a combination of tech, financial services, and healthcare names present. Among this list, Warren Buffett’s Berkshire Hathaway is the closest to becoming the next trillion dollar company.
| Company | Market Cap (USD) |
|---|---|
| 🇺🇸 Berkshire Hathaway | $875B |
| 🇹🇼 TSMC | $749B |
| 🇺🇸 Eli Lilly | $717B |
| 🇩🇰 Novo Nordisk | $604B |
| 🇺🇸 Visa | $583B |
Biggest Companies on International Exchanges
Saudi Aramco is the largest public company listed outside of the U.S., with a mammoth $2.1 trillion valuation.
| Company | Market Cap (USD) |
|---|---|
| 🇸🇦 Saudi Aramco | $2.1T |
| 🇫🇷 LVMH | $469B |
| 🇰🇷 Samsung | $373B |
| 🇨🇳 Tencent | $349B |
| 🇨🇳 Kweichow Moutai | $305B |
It should be noted, however, that the Saudi government directly owns 90% of the company, while another 8% is held by the country’s sovereign wealth fund.
This means that only 2% of shares are actually available to the public, prompting one Bloomberg columnist to call the firm’s valuation an “illusion”.

-

 Education1 week ago
How Hard Is It to Get Into an Ivy League School?
-

 Technology2 weeks ago
Ranked: Semiconductor Companies by Industry Revenue Share
-

 Markets2 weeks ago
Ranked: The World’s Top Flight Routes, by Revenue
-

 Demographics2 weeks ago
Population Projections: The World’s 6 Largest Countries in 2075
-

 Markets2 weeks ago
The Top 10 States by Real GDP Growth in 2023
-

 Demographics2 weeks ago
The Smallest Gender Wage Gaps in OECD Countries
-

 Economy2 weeks ago
Where U.S. Inflation Hit the Hardest in March 2024
-

 Green2 weeks ago
Top Countries By Forest Growth Since 2001