Markets
The Best and Worst Performing Sectors in 2023
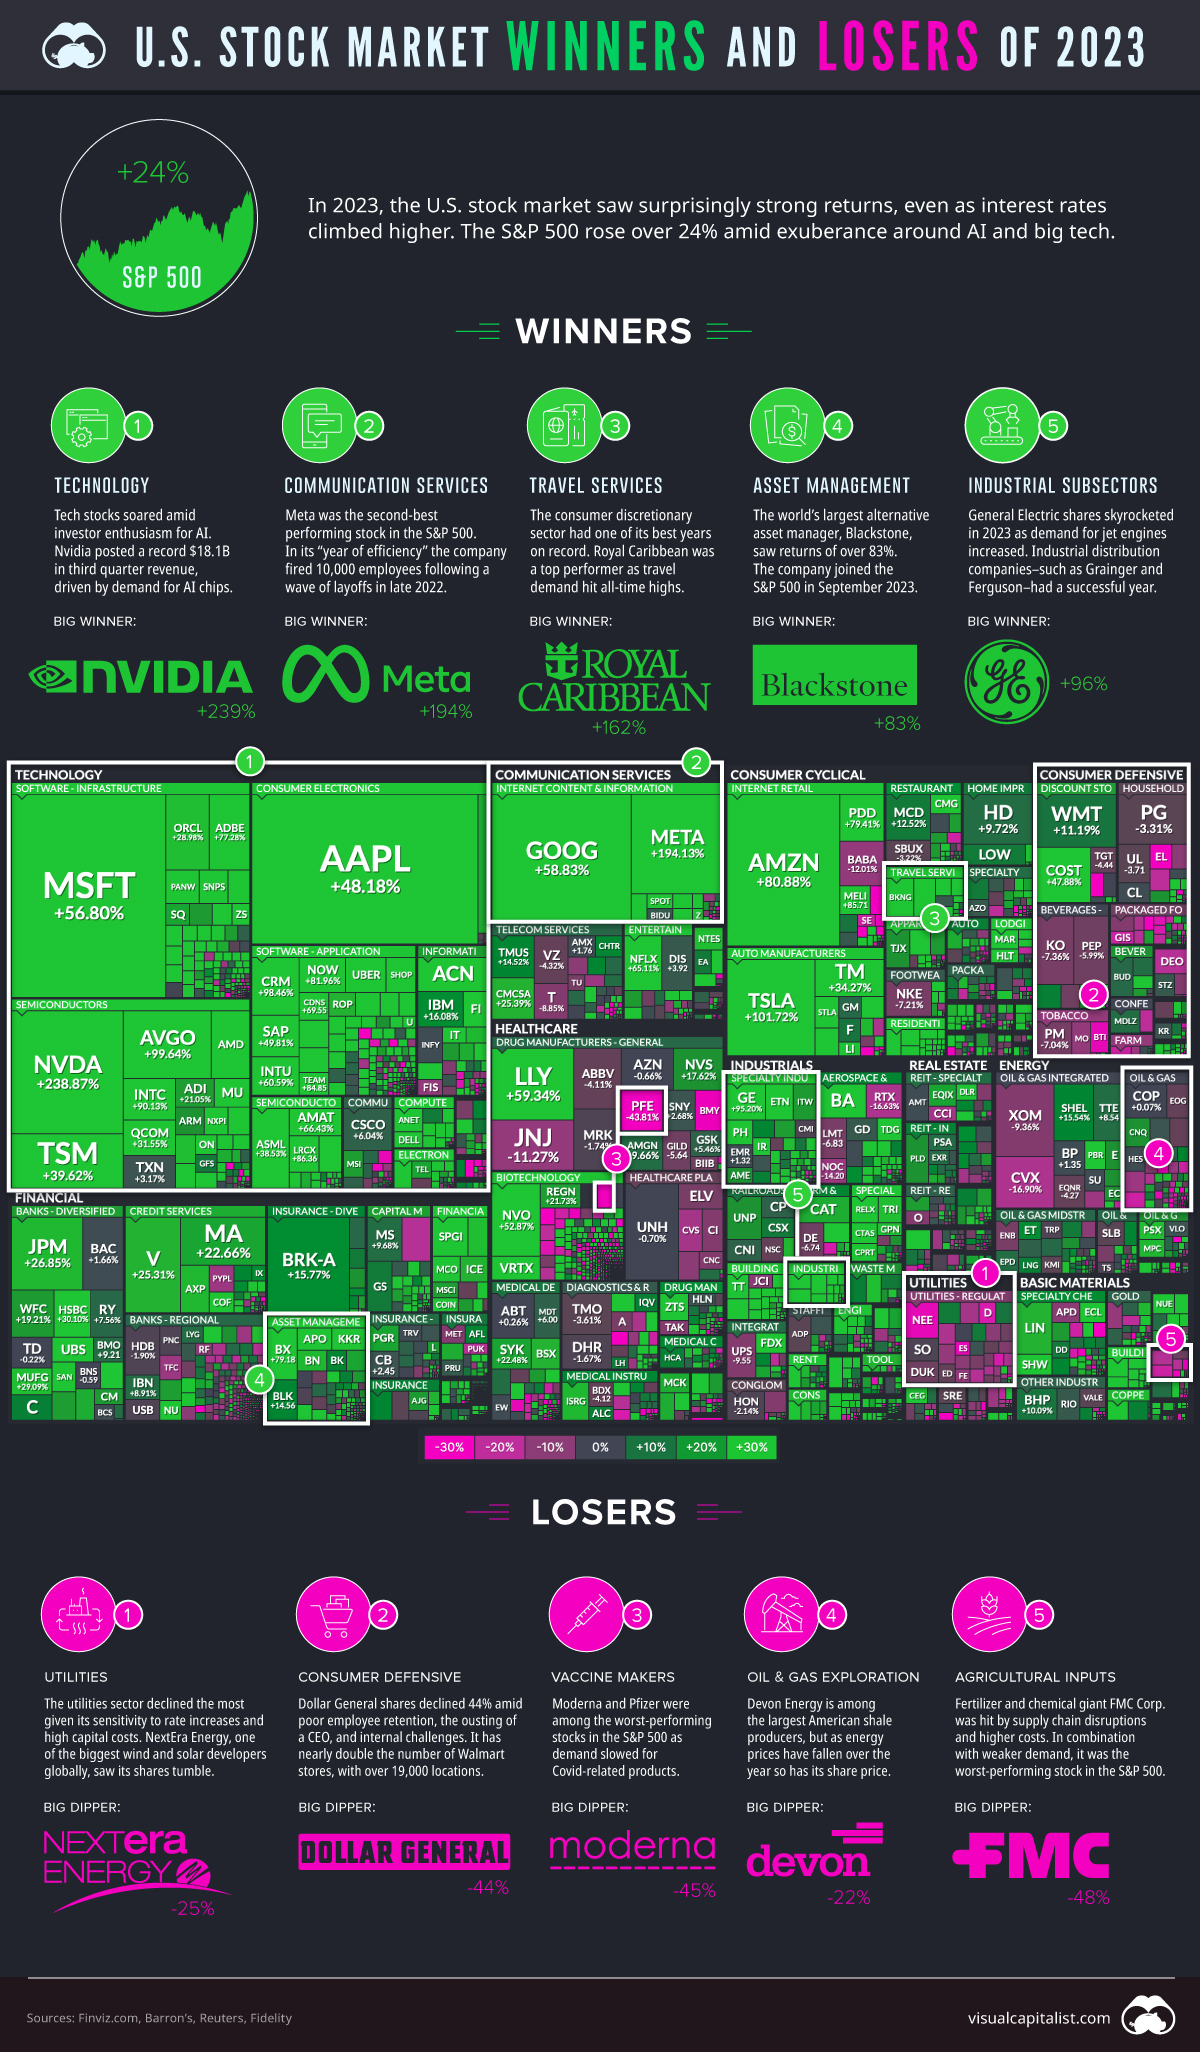
The Best and Worst Performing Sectors in 2023
In 2023, the U.S. stock market saw surprisingly strong returns, even as interest rates climbed higher.
The S&P 500 rose over 24% amid exuberance around AI stocks and big tech, lifting returns across the index. Traditionally defensive stocks, on the other hand, declined. Overall the stock market recovered losses from 2022’s plunge, and is now hovering near all-time highs.
The above graphic is an augmented version of the Finviz treemap, showing the best and worst sectors in 2023.
2023 Winners
Several sectors were in the green this year amid solid consumer spending and steady economic growth. Below, we’ll look at some of the strongest performers:
Technology
In a breakthrough year, the promise of AI’s potential catapulted the tech sector to 56% returns.
Chipmaker Nvidia skyrocketed 239% as demand for AI chips accelerated. Apple and Microsoft each had banner years after a dismal 2022. Overall, big tech stocks were responsible for a large share of the S&P 500’s gains.
In fact, the “Magnificent Seven”—made up of Nvidia, Apple, Microsoft, Alphabet, Amazon, Tesla, and Meta—drove an estimated 75% of the market’s returns and together, they cover about 30% of its total value.
| Company | Sector | 2023 Return |
|---|---|---|
| Nvidia | Information Technology | +239% |
| Apple | Information Technology | +48% |
| Microsoft | Information Technology | +57% |
| Alphabet | Communication Services | +59% |
| Amazon | Consumer Discretionary | +81% |
| Tesla | Consumer Discretionary | +102% |
| Meta | Communication Services | +194% |
Communication Services
As the second-best sector, communication services rallied 54% in 2023. From media and internet companies to telecom and broadband service providers, the sector covers a diverse range of companies—many that may stand to benefit from generative AI.
With 194% gains, Meta was a top performer as advertising revenue improved. At the same time, Netflix (+65%), Alphabet (+59%), and video game publisher Take-Two Interactive (+55%) each saw strong momentum.
Consumer Cyclical/Discretionary
In one of the best years on record, the S&P 500 consumer discretionary sector witnessed over 41% returns. Amazon, Home Depot, and Tesla fall within this sector and each saw at least double-digit returns supported by solid retail sales. Tesla is projected to see record deliveries in 2023.
Cruise-line operator Royal Caribbean was a leading company, with over 162% returns for the year. Record travel demand drove strong performance across both Royal Caribbean and Carnival.
2023 Losers
Unlike cyclical and growth-oriented sectors, defensives did not fare as well. Here are some of the poorest performers of 2023:
Utilities
With -10% returns, utilities declined the most as high interest rates weighed on borrowing costs in the capital-intensive sector.
Not only that, utilities became less attractive as 10-year Treasury yields were higher than utilities dividend yields in 2023—a first in over a decade. In this way, investors looking for income shifted away from the sector.
The good news for utilities is that interest rates are projected to fall over the next several years, according to IMF projections.
Energy
Oil prices declined 10% in 2023, and the sector also ended in the red. Despite OPEC+ production cuts aimed to boost prices, key benchmarks sank 20% from their annual peak.
Devon Energy, one of the largest American shale producers declined 22% and Chevron dropped 14% as oil production and refinery operations missed targets.
Consumer Staples/Defensive
While the consumer staples outperformed in 2022, investors had a different view on it this year. This led to a mixed bag of returns in the sector.
Known for companies that make everyday items, consumer staples covers Coca-Cola, Procter & Gamble, and Walmart. Within the sector, packaged food faced some of the worst declines amid competition from lower-priced products as consumers looked to more affordable options.
What’s Next for 2024?
Whether or not mega cap growth stocks will continue to power the U.S. stock market is anyone’s guess.
While economic signals appear steady, it may be some time yet until interest rates fall to 2%. A second burst of inflation may also resurface if geopolitical tensions get worse. How this all impacts U.S. stock market returns may continue to upend expectations in the post-pandemic era.


Markets
The European Stock Market: Attractive Valuations Offer Opportunities
On average, the European stock market has valuations that are nearly 50% lower than U.S. valuations. But how can you access the market?


European Stock Market: Attractive Valuations Offer Opportunities
Europe is known for some established brands, from L’Oréal to Louis Vuitton. However, the European stock market offers additional opportunities that may be lesser known.
The above infographic, sponsored by STOXX, outlines why investors may want to consider European stocks.
Attractive Valuations
Compared to most North American and Asian markets, European stocks offer lower or comparable valuations.
| Index | Price-to-Earnings Ratio | Price-to-Book Ratio |
|---|---|---|
| EURO STOXX 50 | 14.9 | 2.2 |
| STOXX Europe 600 | 14.4 | 2 |
| U.S. | 25.9 | 4.7 |
| Canada | 16.1 | 1.8 |
| Japan | 15.4 | 1.6 |
| Asia Pacific ex. China | 17.1 | 1.8 |
Data as of February 29, 2024. See graphic for full index names. Ratios based on trailing 12 month financials. The price to earnings ratio excludes companies with negative earnings.
On average, European valuations are nearly 50% lower than U.S. valuations, potentially offering an affordable entry point for investors.
Research also shows that lower price ratios have historically led to higher long-term returns.
Market Movements Not Closely Connected
Over the last decade, the European stock market had low-to-moderate correlation with North American and Asian equities.
The below chart shows correlations from February 2014 to February 2024. A value closer to zero indicates low correlation, while a value of one would indicate that two regions are moving in perfect unison.
| EURO STOXX 50 | STOXX EUROPE 600 | U.S. | Canada | Japan | Asia Pacific ex. China |
|
|---|---|---|---|---|---|---|
| EURO STOXX 50 | 1.00 | 0.97 | 0.55 | 0.67 | 0.24 | 0.43 |
| STOXX EUROPE 600 | 1.00 | 0.56 | 0.71 | 0.28 | 0.48 | |
| U.S. | 1.00 | 0.73 | 0.12 | 0.25 | ||
| Canada | 1.00 | 0.22 | 0.40 | |||
| Japan | 1.00 | 0.88 | ||||
| Asia Pacific ex. China | 1.00 |
Data is based on daily USD returns.
European equities had relatively independent market movements from North American and Asian markets. One contributing factor could be the differing sector weights in each market. For instance, technology makes up a quarter of the U.S. market, but health care and industrials dominate the broader European market.
Ultimately, European equities can enhance portfolio diversification and have the potential to mitigate risk for investors.
Tracking the Market
For investors interested in European equities, STOXX offers a variety of flagship indices:
| Index | Description | Market Cap |
|---|---|---|
| STOXX Europe 600 | Pan-regional, broad market | €10.5T |
| STOXX Developed Europe | Pan-regional, broad-market | €9.9T |
| STOXX Europe 600 ESG-X | Pan-regional, broad market, sustainability focus | €9.7T |
| STOXX Europe 50 | Pan-regional, blue-chip | €5.1T |
| EURO STOXX 50 | Eurozone, blue-chip | €3.5T |
Data is as of February 29, 2024. Market cap is free float, which represents the shares that are readily available for public trading on stock exchanges.
The EURO STOXX 50 tracks the Eurozone’s biggest and most traded companies. It also underlies one of the world’s largest ranges of ETFs and mutual funds. As of November 2023, there were €27.3 billion in ETFs and €23.5B in mutual fund assets under management tracking the index.
“For the past 25 years, the EURO STOXX 50 has served as an accurate, reliable and tradable representation of the Eurozone equity market.”
— Axel Lomholt, General Manager at STOXX
Partnering with STOXX to Track the European Stock Market
Are you interested in European equities? STOXX can be a valuable partner:
- Comprehensive, liquid and investable ecosystem
- European heritage, global reach
- Highly sophisticated customization capabilities
- Open architecture approach to using data
- Close partnerships with clients
- Part of ISS STOXX and Deutsche Börse Group
With a full suite of indices, STOXX can help you benchmark against the European stock market.
Learn how STOXX’s European indices offer liquid and effective market access.

-

 Economy3 days ago
Economic Growth Forecasts for G7 and BRICS Countries in 2024
The IMF has released its economic growth forecasts for 2024. How do the G7 and BRICS countries compare?
-

 Markets2 weeks ago
U.S. Debt Interest Payments Reach $1 Trillion
U.S. debt interest payments have surged past the $1 trillion dollar mark, amid high interest rates and an ever-expanding debt burden.
-

 United States2 weeks ago
Ranked: The Largest U.S. Corporations by Number of Employees
We visualized the top U.S. companies by employees, revealing the massive scale of retailers like Walmart, Target, and Home Depot.
-

 Markets2 weeks ago
The Top 10 States by Real GDP Growth in 2023
This graphic shows the states with the highest real GDP growth rate in 2023, largely propelled by the oil and gas boom.
-

 Markets2 weeks ago
Ranked: The World’s Top Flight Routes, by Revenue
In this graphic, we show the highest earning flight routes globally as air travel continued to rebound in 2023.
-

 Markets3 weeks ago
Ranked: The Most Valuable Housing Markets in America
The U.S. residential real estate market is worth a staggering $47.5 trillion. Here are the most valuable housing markets in the country.


-

 Debt1 week ago
How Debt-to-GDP Ratios Have Changed Since 2000
-
Markets2 weeks ago
Ranked: The World’s Top Flight Routes, by Revenue
-

 Countries2 weeks ago
Population Projections: The World’s 6 Largest Countries in 2075
-
Markets2 weeks ago
The Top 10 States by Real GDP Growth in 2023
-

 Demographics2 weeks ago
The Smallest Gender Wage Gaps in OECD Countries
-

 United States2 weeks ago
Where U.S. Inflation Hit the Hardest in March 2024
-

 Green2 weeks ago
Top Countries By Forest Growth Since 2001
-
United States2 weeks ago
Ranked: The Largest U.S. Corporations by Number of Employees