

This graphic shows how Nvidia's revenue sources have changed over time, highlighting how the AI boom has transformed its bottom line.


Cloud computing service providers generated $270 billion in revenues last year, concentrated among a few giants.


This graphic breaks down Microsoft's revenue by segment—from cloud office software to AI search engine capabilities in 2023.
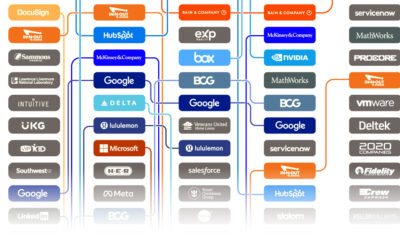

Glassdoor’s annual list is determined by an algorithm that converts reviews to ratings—here are America's 15 best places to work since 2020.


In 2023, iPhones accounted for more than half of Apple's revenue.
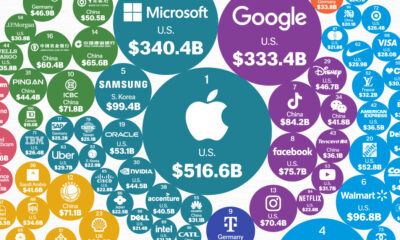

This graphic shows the world's most valuable brands, from big tech giants to battery makers powering green technology.


We visualize some of the bigger tech layoffs in the year so far, from video game software provider Unity to big tech bastion Google.


Which companies and sectors generate the most profit per employee? We rank the top 25 companies in the U.S. based on this interesting metric.


Where does the internet live? This graphic highlights the biggest data center markets in the world by electricity consumption.
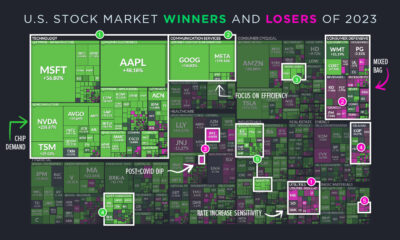

Here are the best performing sectors of 2023—and the ones that fell behind—in a year defined by AI, high interest rates, and resilience.


 Creator Program