Misc
Almost Every EV Stock is Down After Q1 2024
![]() See this visualization first on the Voronoi app.
See this visualization first on the Voronoi app.
Almost Every EV Stock is Down After Q1 2024
This was originally posted on our Voronoi app. Download the app for free on iOS or Android and discover incredible data-driven charts from a variety of trusted sources.
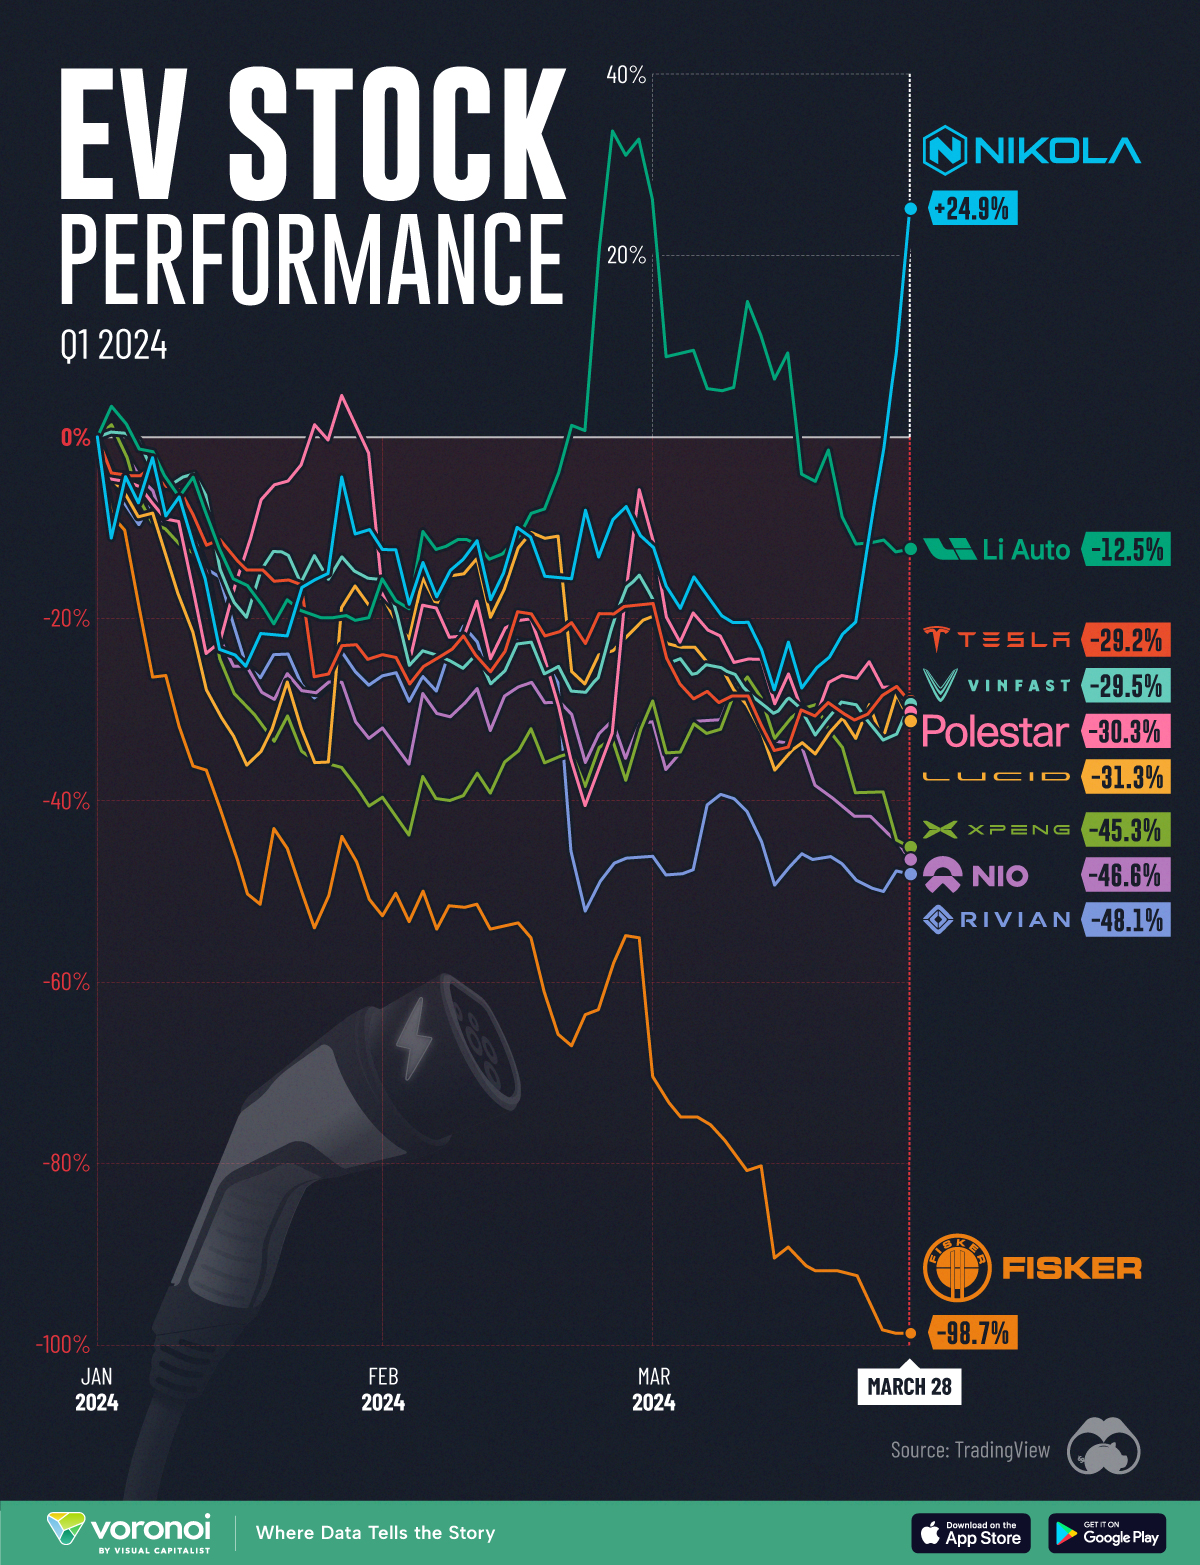
While the S&P 500 index climbed over 10% in Q1 2024, the majority of EV stocks declined by double digit percentages over the period.
This is surprising, given that EVs were once the hottest trend in tech (before artificial intelligence came around).
In this graphic, we’ve visualized the Q1 2024 performance of 10 prominent pure play EV companies. Pure play in this context means companies that only focus on electric vehicles.
EV Stock Performance
The data we used to create this graphic can be found in the table below. Note the two biggest outliers: Nikola (+24.9%) and Fisker (-98.7%).
| Company | Q1 Price Change (%) |
|---|---|
| Nikola | +24.9 |
| Li Auto | -12.5 |
| Tesla | -29.2 |
| VinFast | -29.5 |
| Polestar | -30.3 |
| Lucid | -31.3 |
| XPeng | -45.3 |
| Nio | -46.6 |
| Rivian | -48.1 |
| Fisker | -98.7 |
The majority of EV stocks have fallen due to slowing demand in major markets like the U.S. and China. This is a serious problem for startups like Rivian and Lucid, which are not yet profitable.
In fact, legacy automakers like Ford are looking to expand production of hybrid vehicles, which is likely causing many investors to avoid pure EV stocks.
Two Outliers Emerge
Nikola shares have rallied in recent weeks as the company reported positive momentum in its hydrogen fuel cell truck business. The company also opened its first hydrogen refueling station in Southern California, and has five more in the works.
On the flipside, Fisker Inc. has struggled enormously, even being delisted from the NYSE in late March 2024. Fisker Inc. is the successor to Fisker Automotive, which went bankrupt in 2013. Fisker Automotive was known for producing the Karma, a luxury EV sedan that competed with the Tesla Model S.
Back to today’s Fisker, the company is once again in hot water. Over 40,000 customers have cancelled reservations for the company’s “Ocean” electric SUV, which is currently under investigation for door malfunctions.
Other Major EV Developments
In other news, Tesla is once again the world’s best-selling EV company, after outselling China’s BYD by 87,000 units in Q1 2024.


Misc
Visualizing the Most Common Pets in the U.S.
Lions, tigers, and bears, oh my!—these animals do not feature on this list of popular American household pets.


Visualizing The Most Common Pets in the U.S.
This was originally posted on our Voronoi app. Download the app for free on iOS or Android and discover incredible data-driven charts from a variety of trusted sources.
In this graphic, we visualized the most common American household pets, based on 2023-2024 data from the American Pet Products Association (accessed via Forbes Advisor).
Figures represent the number of households that own each pet type, rather than the actual number of each animal. The “small animal” category includes hamsters, gerbils, rabbits, guinea pigs, chinchillas, mice, rats, and ferrets.
What is the Most Popular American Household Pet?
Based on this data, dogs—one of the first domesticated animals—are the most common pets in the United States. In fact, around 65 million households own a dog, and spend an average of $900 a year on their care.
| Rank | Species | Households |
|---|---|---|
| 1 | 🐶 Dog | 65M |
| 2 | 🐱 Cat | 47M |
| 3 | 🐟 Freshwater Fish | 11M |
| 4 | 🐰 Small Animals | 7M |
| 5 | 🐦 Bird | 6M |
| 6 | 🦎 Reptile | 6M |
| 7 | 🐴 Horse | 2M |
| 8 | 🐠 Saltwater Fish | 2M |
Note: Households can own multiple pets, and are counted for all relevant categories.
Cats rank second, at 47 million households, and these smaller felines are a little less expensive to own at $700/year according to Forbes estimates.
But aside from these two juggernauts, there are plenty of other common pet types found in households across the country.
Freshwater fish can be found in 11 million households, along with small animals—rabbits, hamsters, guinea pigs—in 7 million. Meanwhile, nearly 6 million homes have birds or reptiles.
Pet Ownership is on the Rise in America
Forbes found that 66% of all American households (numbering 87 million) own at least one pet, up from 56% in 1988. One third of these (29 million) own multiple pets.
A combination of factors is driving this increase: rising incomes, delayed childbirth, and of course the impact of the pandemic which nearly cleared out animal shelters across the globe.
America’s loneliness epidemic may also be a factor. Fledgling research has shown that single-individual households with pets recorded lower rates of loneliness during the pandemic than those without a pet.

-

 Demographics6 days ago
The Countries That Have Become Sadder Since 2010
-

 Green2 weeks ago
Ranked: The Countries With the Most Air Pollution in 2023
-

 Green2 weeks ago
Ranking the Top 15 Countries by Carbon Tax Revenue
-

 Markets2 weeks ago
U.S. Debt Interest Payments Reach $1 Trillion
-

 Mining2 weeks ago
Gold vs. S&P 500: Which Has Grown More Over Five Years?
-

 Energy2 weeks ago
The World’s Biggest Nuclear Energy Producers
-

 Misc2 weeks ago
How Hard Is It to Get Into an Ivy League School?
-

 Debt2 weeks ago
How Debt-to-GDP Ratios Have Changed Since 2000