Misc
Tesla Is Once Again the World’s Best-Selling EV Company
![]() See this visualization first on the Voronoi app.
See this visualization first on the Voronoi app.
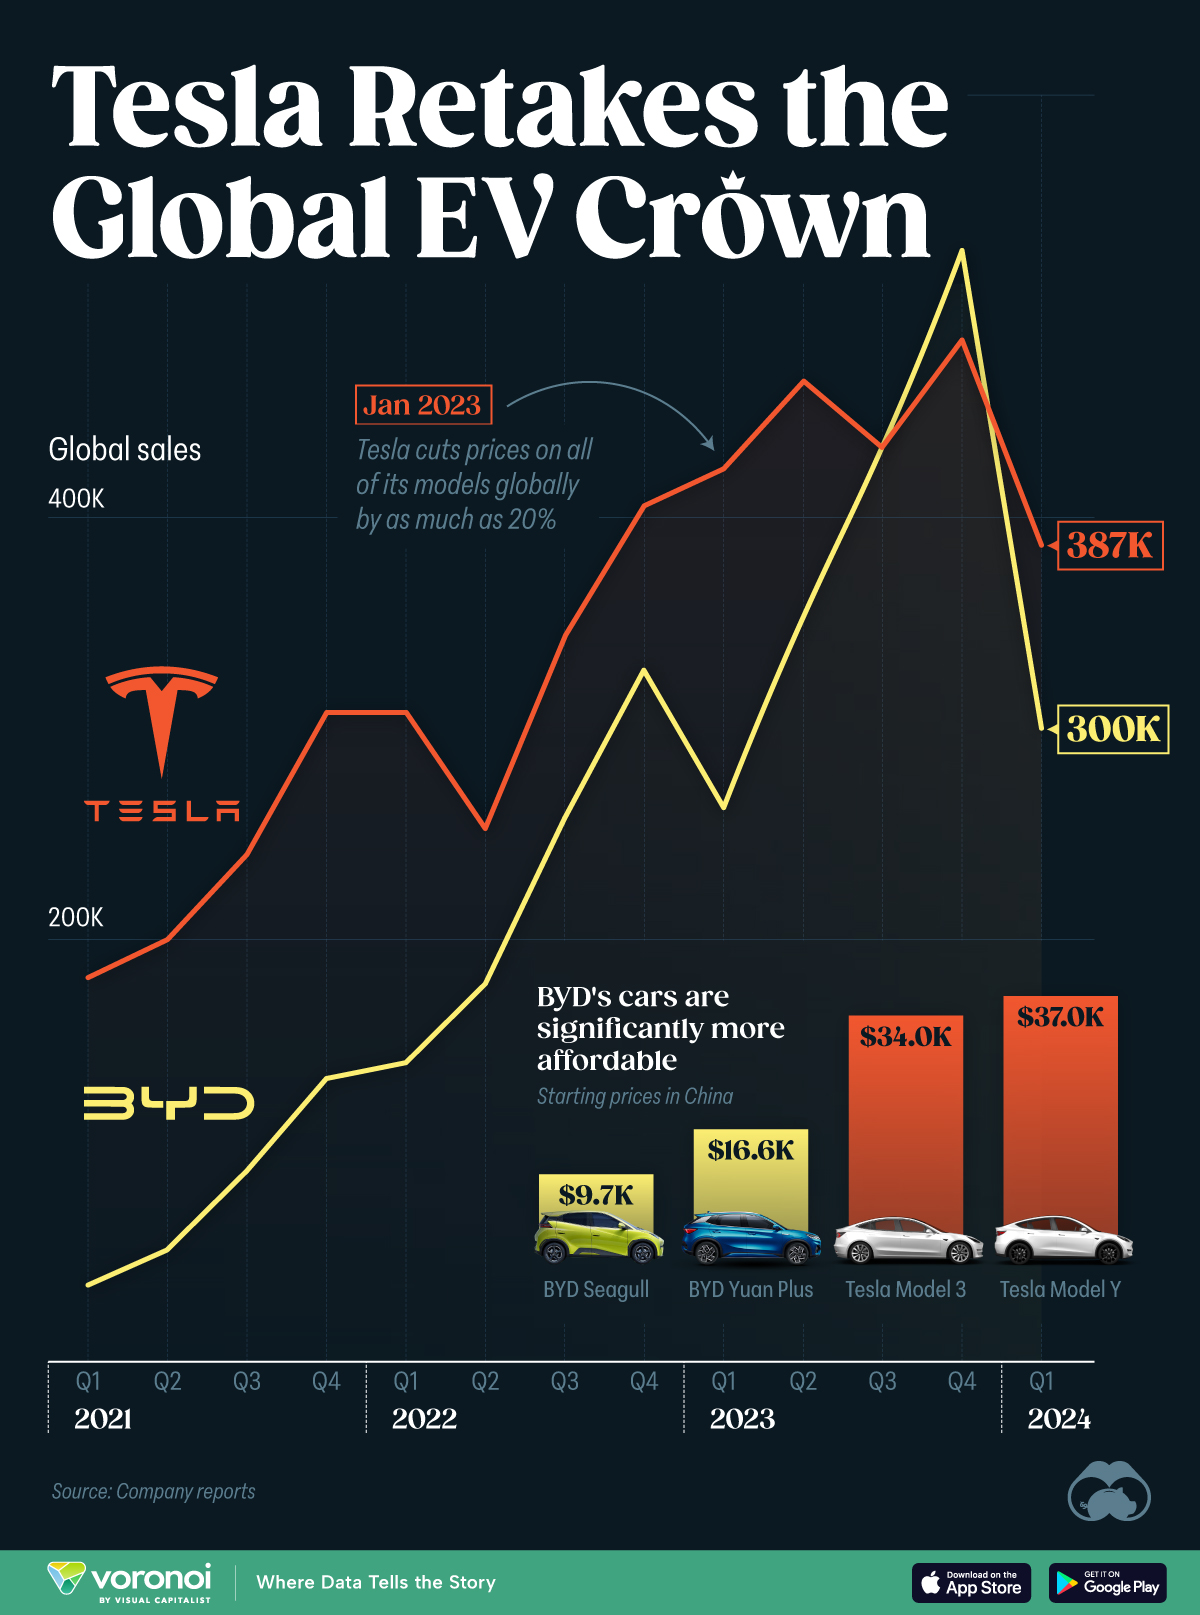
Quarterly BEV Sales: Tesla vs BYD
This was originally posted on our Voronoi app. Download the app for free on iOS or Android and discover incredible data-driven charts from a variety of trusted sources.
China’s BYD made waves for outselling Tesla in Q4 2023, prompting many to believe that the once dominant EV king would fall further behind in 2024.
However, figures for Q1 2024 are now out, and they reveal a dramatic 43% decline in BYD sales from the previous quarter. Meanwhile, Tesla reported a slightly less painful 20% drop in sales.
To see how this battle is playing out, we visualized the global BEV sales of both companies over the past several years. Exact figures can be found in the table below.
| Quarter | Tesla | BYD |
|---|---|---|
| 2022 Q1 | 310,048 | 143,223 |
| 2022 Q2 | 254,695 | 180,296 |
| 2022 Q3 | 343,830 | 258,610 |
| 2022 Q4 | 405,278 | 329,011 |
| 2023 Q1 | 422,875 | 264,647 |
| 2023 Q2 | 466,140 | 352,145 |
| 2023 Q3 | 435,059 | 431,603 |
| 2023 Q4 | 484,507 | 526,409 |
| 2024 Q1 | 386,810 | 300,114 |
The steep drops reported in Q1 2024 are the latest sign that consumer appetite for fully electric vehicles has slowed, prompting both companies to escalate their ongoing price war. In February 2024, BYD responded to Tesla’s repeated price cuts with its own round of discounts.
BYD Offers a Significantly Lower Entry Point
As shown in the above graphic, starting prices for some of BYD’s electric cars are incredibly low.
In China, the BYD Seagull now starts at 69,800 yuan ($9,700), while the Yuan Plus (BYD’s Model Y competitor) starts at 119,800 yuan ($16,000). On the other hand, Tesla’s cheapest model (RWD Model 3) costs 245,900 yuan ($34,000). It’s interesting to note that the cheapest Model 3 in the U.S. costs $38,990, according to reporting from CNN.
Learn More About Tesla
If you like seeing data visualizations on the world’s largest EV maker, check out this graphic that breaks down Tesla’s sales by model since 2016.


Misc
Visualizing the Most Common Pets in the U.S.
Lions, tigers, and bears, oh my!—these animals do not feature on this list of popular American household pets.


Visualizing The Most Common Pets in the U.S.
This was originally posted on our Voronoi app. Download the app for free on iOS or Android and discover incredible data-driven charts from a variety of trusted sources.
In this graphic, we visualized the most common American household pets, based on 2023-2024 data from the American Pet Products Association (accessed via Forbes Advisor).
Figures represent the number of households that own each pet type, rather than the actual number of each animal. The “small animal” category includes hamsters, gerbils, rabbits, guinea pigs, chinchillas, mice, rats, and ferrets.
What is the Most Popular American Household Pet?
Based on this data, dogs—one of the first domesticated animals—are the most common pets in the United States. In fact, around 65 million households own a dog, and spend an average of $900 a year on their care.
| Rank | Species | Households |
|---|---|---|
| 1 | 🐶 Dog | 65M |
| 2 | 🐱 Cat | 47M |
| 3 | 🐟 Freshwater Fish | 11M |
| 4 | 🐰 Small Animals | 7M |
| 5 | 🐦 Bird | 6M |
| 6 | 🦎 Reptile | 6M |
| 7 | 🐴 Horse | 2M |
| 8 | 🐠 Saltwater Fish | 2M |
Note: Households can own multiple pets, and are counted for all relevant categories.
Cats rank second, at 47 million households, and these smaller felines are a little less expensive to own at $700/year according to Forbes estimates.
But aside from these two juggernauts, there are plenty of other common pet types found in households across the country.
Freshwater fish can be found in 11 million households, along with small animals—rabbits, hamsters, guinea pigs—in 7 million. Meanwhile, nearly 6 million homes have birds or reptiles.
Pet Ownership is on the Rise in America
Forbes found that 66% of all American households (numbering 87 million) own at least one pet, up from 56% in 1988. One third of these (29 million) own multiple pets.
A combination of factors is driving this increase: rising incomes, delayed childbirth, and of course the impact of the pandemic which nearly cleared out animal shelters across the globe.
America’s loneliness epidemic may also be a factor. Fledgling research has shown that single-individual households with pets recorded lower rates of loneliness during the pandemic than those without a pet.

-

 Demographics6 days ago
The Countries That Have Become Sadder Since 2010
-

 Green2 weeks ago
Ranked: The Countries With the Most Air Pollution in 2023
-

 Green2 weeks ago
Ranking the Top 15 Countries by Carbon Tax Revenue
-

 Markets2 weeks ago
U.S. Debt Interest Payments Reach $1 Trillion
-

 Mining2 weeks ago
Gold vs. S&P 500: Which Has Grown More Over Five Years?
-

 Energy2 weeks ago
The World’s Biggest Nuclear Energy Producers
-

 Misc2 weeks ago
How Hard Is It to Get Into an Ivy League School?
-

 Debt2 weeks ago
How Debt-to-GDP Ratios Have Changed Since 2000