Misc
Which U.S. College Major is the Worst for Finding a Job?
![]() See this visualization first on the Voronoi app.
See this visualization first on the Voronoi app.
Which U.S. College Major is the Worst for Finding a Job?
This was originally posted on our Voronoi app. Download the app for free on Apple or Android and discover incredible data-driven charts from a variety of trusted sources.
Finding a job can often be a Sisyphean task in this rapidly changing modern economy. Highly sought after skills come and go, following the greater tides of technology change, marketplace behavior, and shifting consumer patterns.
After all, take a look at what’s happening in the tech world.
Education plays an important role in this job hunting business of course. And some skill sets are losing their sheen, with their practitioners having a harder time than others in securing gainful employment.
But which ones are the worst right now?
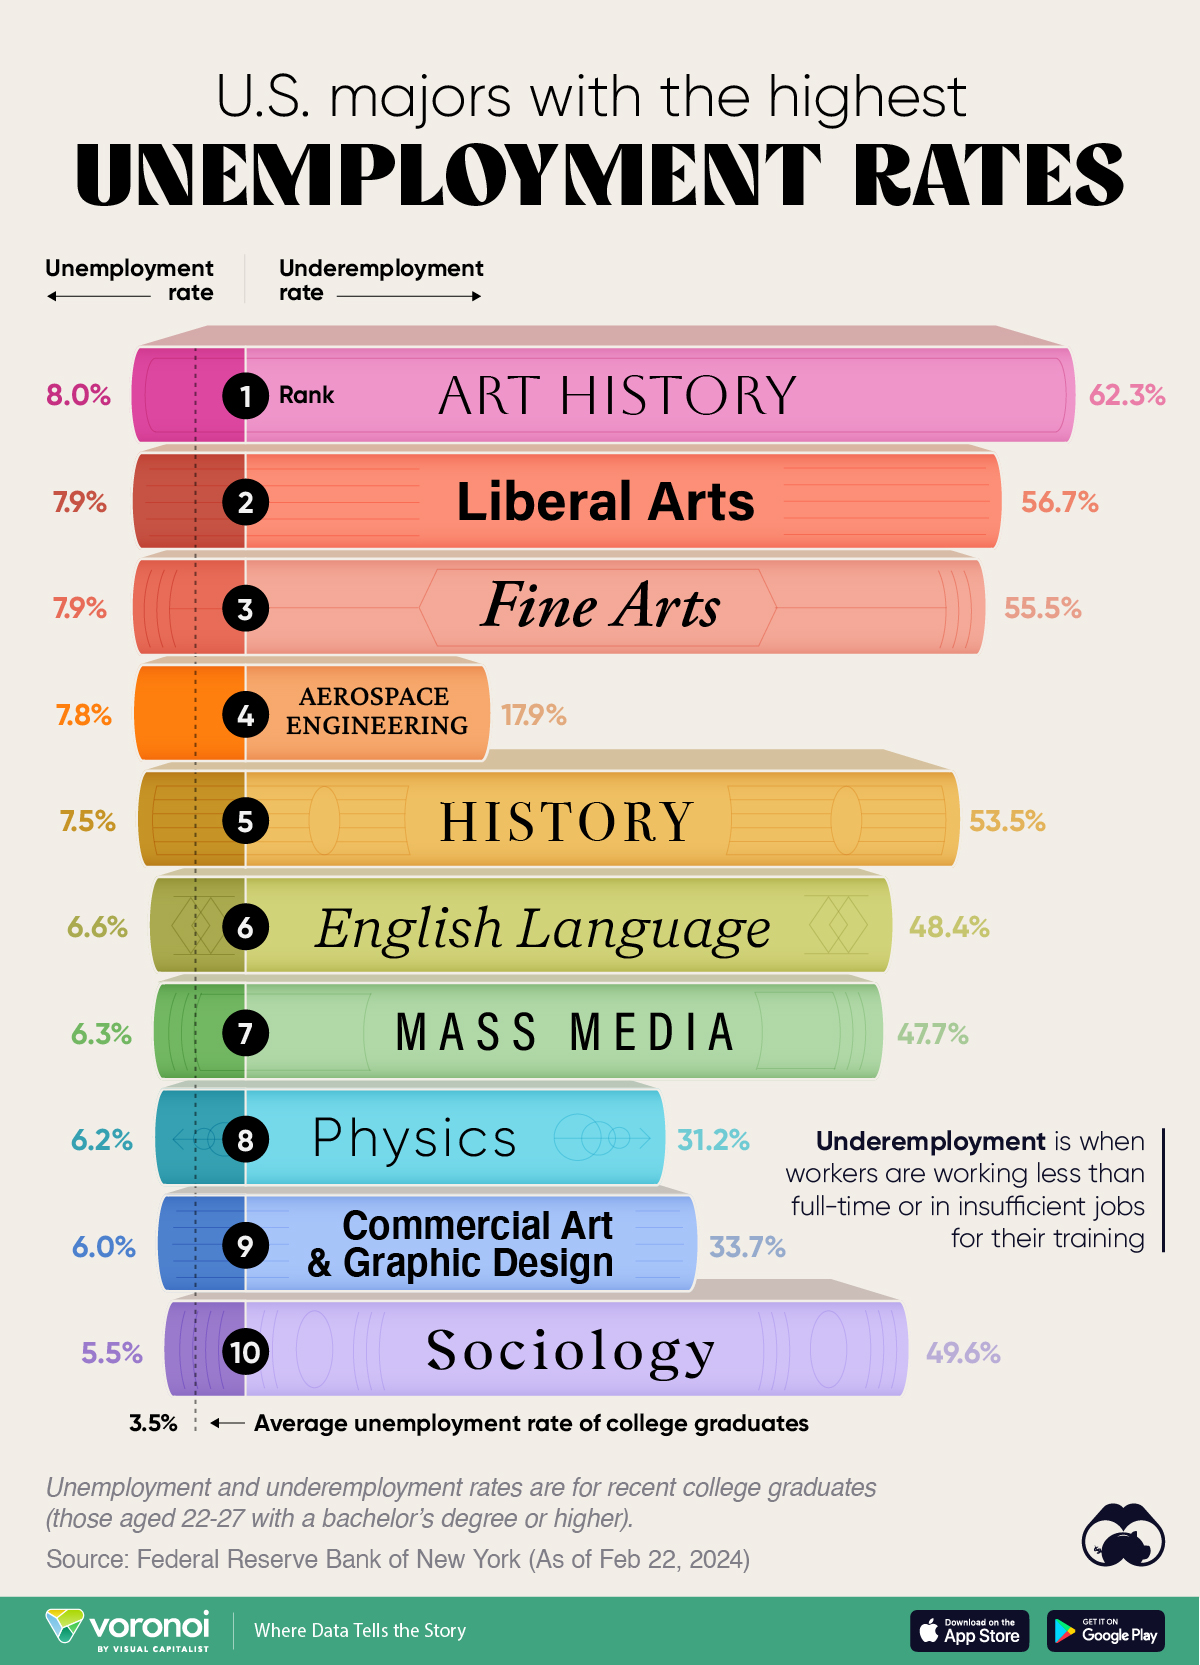
We visualize the top 10 U.S. college majors, ranked by their unemployment rate, including their underemployment rate for additional context. These figures are of recent college graduates (those aged 22–27 with a bachelor’s degree or higher) and are sourced from the New York Federal Reserve, current up to February 2024.
Ranked: U.S. Majors with the Highest Unemployment Rates
Heading the first three spots on this list are all the majors with “art” in their name.
Nearly 8% of recent Art History, Liberal Arts, and Fine Arts graduates are unemployed, with more than 50% of them underemployed.
| Rank | U.S. Major | Unemployment Rate | Underemployment Rate |
|---|---|---|---|
| 1 | 🎨 Art History | 8.0% | 62.3% |
| 2 | 📘 Liberal Arts | 7.9% | 56.7% |
| 3 | 🖌️ Fine Arts | 7.9% | 55.5% |
| 4 | 🚀 Aerospace Engineering | 7.8% | 17.9% |
| 5 | 📜 History | 7.5% | 53.5% |
| 6 | 📚 English Language | 6.6% | 48.4% |
| 7 | 📺 Mass Media | 6.3% | 47.7% |
| 8 | 🔬 Physics | 6.2% | 31.2% |
| 9 | 🎨 Commercial Art & Graphic Design | 6.0% | 33.7% |
| 10 | 👥 Sociology | 5.5% | 49.6% |
| N/A | 📉 Average Rate | 3.5% | 40.3% |
At fourth place, 7.8% of recent Aerospace Engineering majors have not found a job—a surprising statistic since engineering is regarded as one of the more stable majors to study.
In fact from same data source, Industrial and Mechanical engineers have some of the lowest unemployment rates in the country.
However, aerospace engineering jobs tend to be clustered around the big companies in an otherwise small industry, with additional requirements for security clearances. Tellingly, the underemployment rate for aerospace engineering graduates is less than 20%, which is the best out of this list.
At fifth, sixth, and seventh place are History (7.5%), English (6.6%), and Mass Media (6.3%) of which the former two have also seen a rapid decline in undergraduates in the last decade.


Misc
Visualizing the Most Common Pets in the U.S.
Lions, tigers, and bears, oh my!—these animals do not feature on this list of popular American household pets.


Visualizing The Most Common Pets in the U.S.
This was originally posted on our Voronoi app. Download the app for free on iOS or Android and discover incredible data-driven charts from a variety of trusted sources.
In this graphic, we visualized the most common American household pets, based on 2023-2024 data from the American Pet Products Association (accessed via Forbes Advisor).
Figures represent the number of households that own each pet type, rather than the actual number of each animal. The “small animal” category includes hamsters, gerbils, rabbits, guinea pigs, chinchillas, mice, rats, and ferrets.
What is the Most Popular American Household Pet?
Based on this data, dogs—one of the first domesticated animals—are the most common pets in the United States. In fact, around 65 million households own a dog, and spend an average of $900 a year on their care.
| Rank | Species | Households |
|---|---|---|
| 1 | 🐶 Dog | 65M |
| 2 | 🐱 Cat | 47M |
| 3 | 🐟 Freshwater Fish | 11M |
| 4 | 🐰 Small Animals | 7M |
| 5 | 🐦 Bird | 6M |
| 6 | 🦎 Reptile | 6M |
| 7 | 🐴 Horse | 2M |
| 8 | 🐠 Saltwater Fish | 2M |
Note: Households can own multiple pets, and are counted for all relevant categories.
Cats rank second, at 47 million households, and these smaller felines are a little less expensive to own at $700/year according to Forbes estimates.
But aside from these two juggernauts, there are plenty of other common pet types found in households across the country.
Freshwater fish can be found in 11 million households, along with small animals—rabbits, hamsters, guinea pigs—in 7 million. Meanwhile, nearly 6 million homes have birds or reptiles.
Pet Ownership is on the Rise in America
Forbes found that 66% of all American households (numbering 87 million) own at least one pet, up from 56% in 1988. One third of these (29 million) own multiple pets.
A combination of factors is driving this increase: rising incomes, delayed childbirth, and of course the impact of the pandemic which nearly cleared out animal shelters across the globe.
America’s loneliness epidemic may also be a factor. Fledgling research has shown that single-individual households with pets recorded lower rates of loneliness during the pandemic than those without a pet.

-

 Economy7 days ago
VC+: Get Our Key Takeaways From the IMF’s World Economic Outlook
-

 Maps2 weeks ago
The Largest Earthquakes in the New York Area (1970-2024)
-

 Green2 weeks ago
Ranked: The Countries With the Most Air Pollution in 2023
-

 Green2 weeks ago
Ranking the Top 15 Countries by Carbon Tax Revenue
-

 Markets2 weeks ago
U.S. Debt Interest Payments Reach $1 Trillion
-

 Mining2 weeks ago
Gold vs. S&P 500: Which Has Grown More Over Five Years?
-

 Energy2 weeks ago
The World’s Biggest Nuclear Energy Producers
-

 Misc2 weeks ago
How Hard Is It to Get Into an Ivy League School?