Agriculture
Timeline: The Domestication of Animals


Timeline: The Domestication of Animals
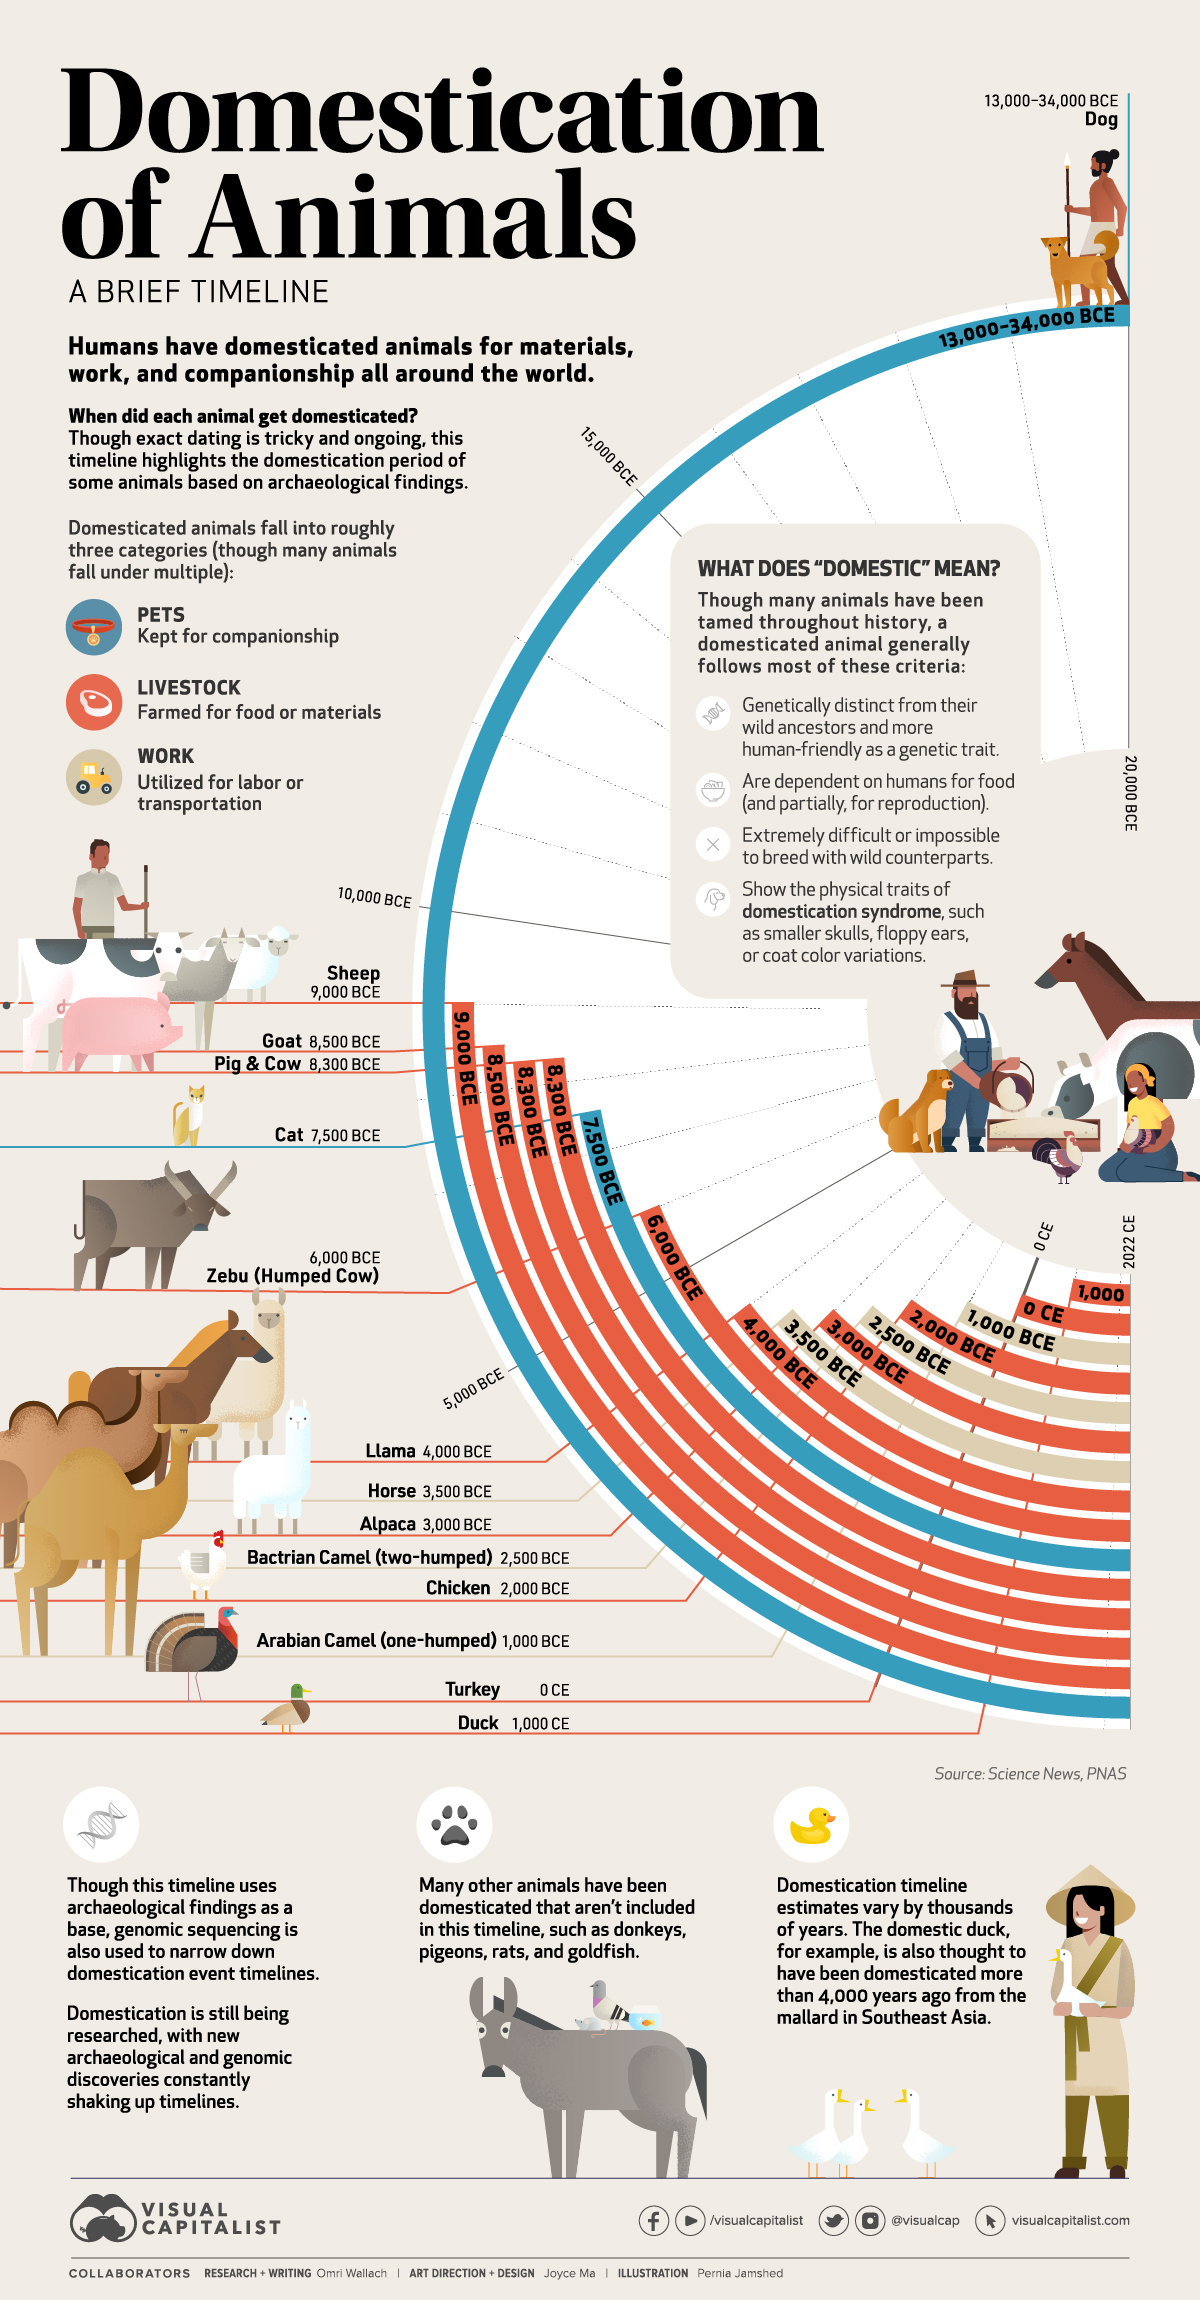
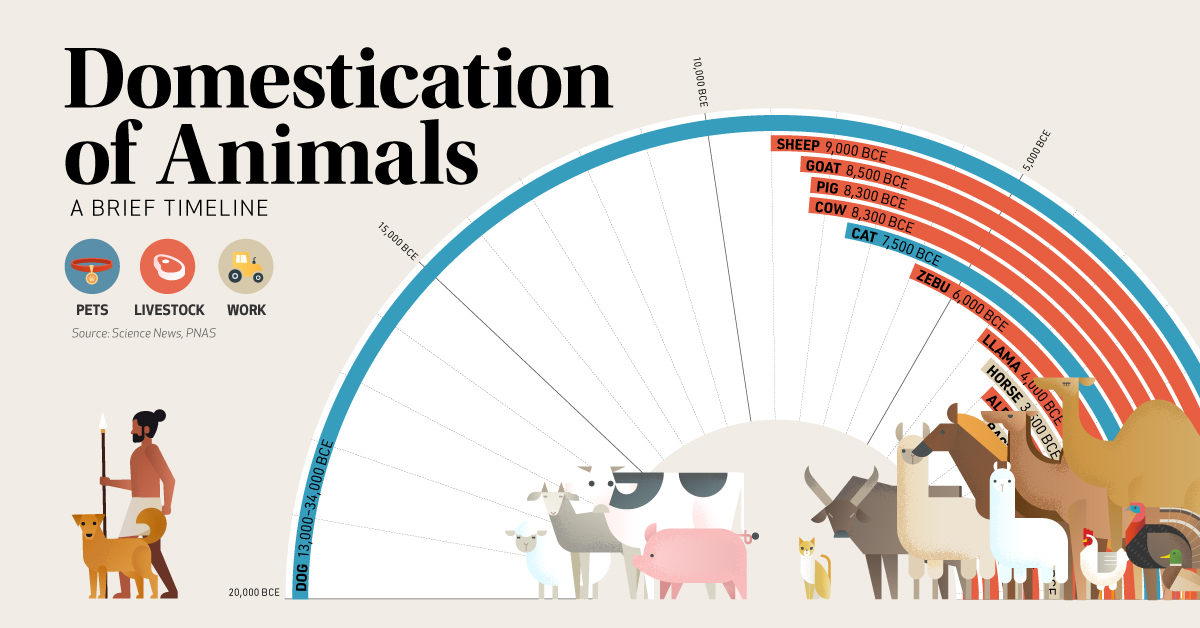
While dogs weren’t always our docile companions, research indicates that they were likely one of the first animals to be domesticated by humans. In fact, genetic evidence suggests that dogs split from their wild wolf ancestors around 33,000 years ago.
When did humans domesticate other animals, and why? This timeline highlights the domestication period of 15 different animals, based on archeological findings.
Because exact timing is tricky to pinpoint and research on the topic is ongoing, these estimates may vary by thousands of years.
Defining Domestic
The domestication of animals is a particular process that’s done through selective breeding. Generally speaking, domestic animals follow most of these criteria:
- Genetically distinct from their wild ancestors and more human-friendly as a genetic trait.
- Dependent on humans for food and reproduction.
- They’re extremely difficult or impossible to breed with wild counterparts.
- Show the physical traits of domestication syndrome, such as smaller skulls, floppy ears, or coat color variations.
Domestication is not the same as taming an animal, which is when humans condition wild animals to live in captivity.
While some research suggests that domestic animals can prosper in the wild, domestic animals are typically more susceptible to predators since they lack some of the advantages, instincts, or traits that help their wild counterparts survive in nature.
Key Reasons for the Domestication of Animals
Humans domesticate animals for a number of reasons: some have been domesticated for food, work, companionship, or a combination of all three.
After dogs, livestock animals such as sheep, cows, and pigs are thought to have been some of the first animals to become domesticated by humans. This was around the same time that humanity shifted from a hunter-gathering lifestyle to an agricultural society.
| Domesticated Animal | Primary Type | Estimated Domestication Period | Origin |
|---|---|---|---|
| Dog | Pet | 13,000–34,000 BCE | Eurasia |
| Sheep | Livestock | 9,000 BCE | Middle East |
| Goat | Livestock | 8,500 BCE | Middle East |
| Pig | Livestock | 8,300 BCE | Middle East |
| Cow | Livestock | 8,300 BCE | Middle East |
| Cat | Pet | 7,500 BCE | Middle East |
| Zebu (Humped Cow) | Livestock | 6,000 BCE | South Asia |
| Llama | Livestock | 4,000 BCE | South America |
| Horse | Work | 3,500 BCE | Central Asia |
| Alpaca | Livestock | 3,000 BCE | South America |
| Bactrian Camel (two-humped) | Work | 2,500 BCE | Central Asia |
| Chicken | Livestock | 2,000 BCE | East Asia/Middle East |
| Arabian Camel (one-humped) | Work | 1,000 BCE | Middle East |
| Turkey | Livestock | 0 CE | North America |
| Duck | Livestock | 1,000 CE | East Asia/Middle East |
Horses are thought to be some of the first animals domesticated for work. Scientific research suggests that the modern horse originated in Central Asia, and were selectively bred for their exceptional back strength and overall resilience.
When it comes to domesticating animals, herbivores (like cows) are generally the easiest to convert because they’re easier to feed than animals that rely on meats or grains, which need to be sourced or domesticated themselves.
Domestication Has Shaped Modern Humanity
The domestication of species has helped create our modern society. Domesticating plants and animals created a world with stable food production, which enabled the human population to boom worldwide.
This is because agriculture meant fewer people could provide more food to humans on a mass scale, so people had more time to focus on other things like creative pursuits, scientific research, etc. This gave us time to create tools that helped boost efficiencies in farming and agriculture, leading to the world as we know it today.


Agriculture
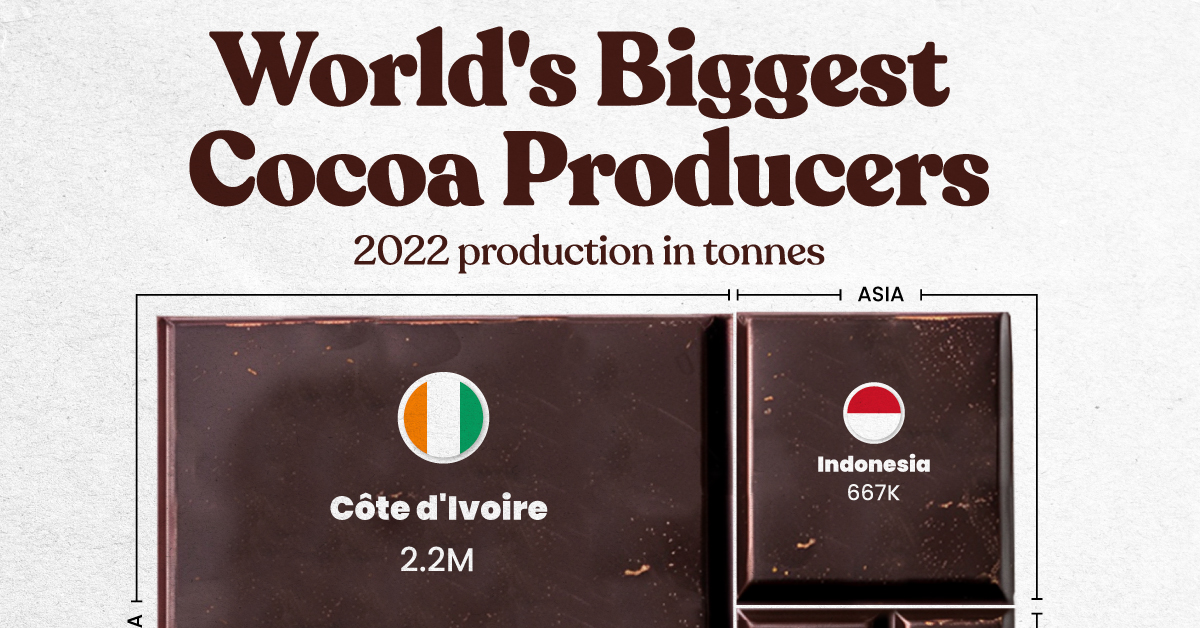
The World’s Top Cocoa Producing Countries
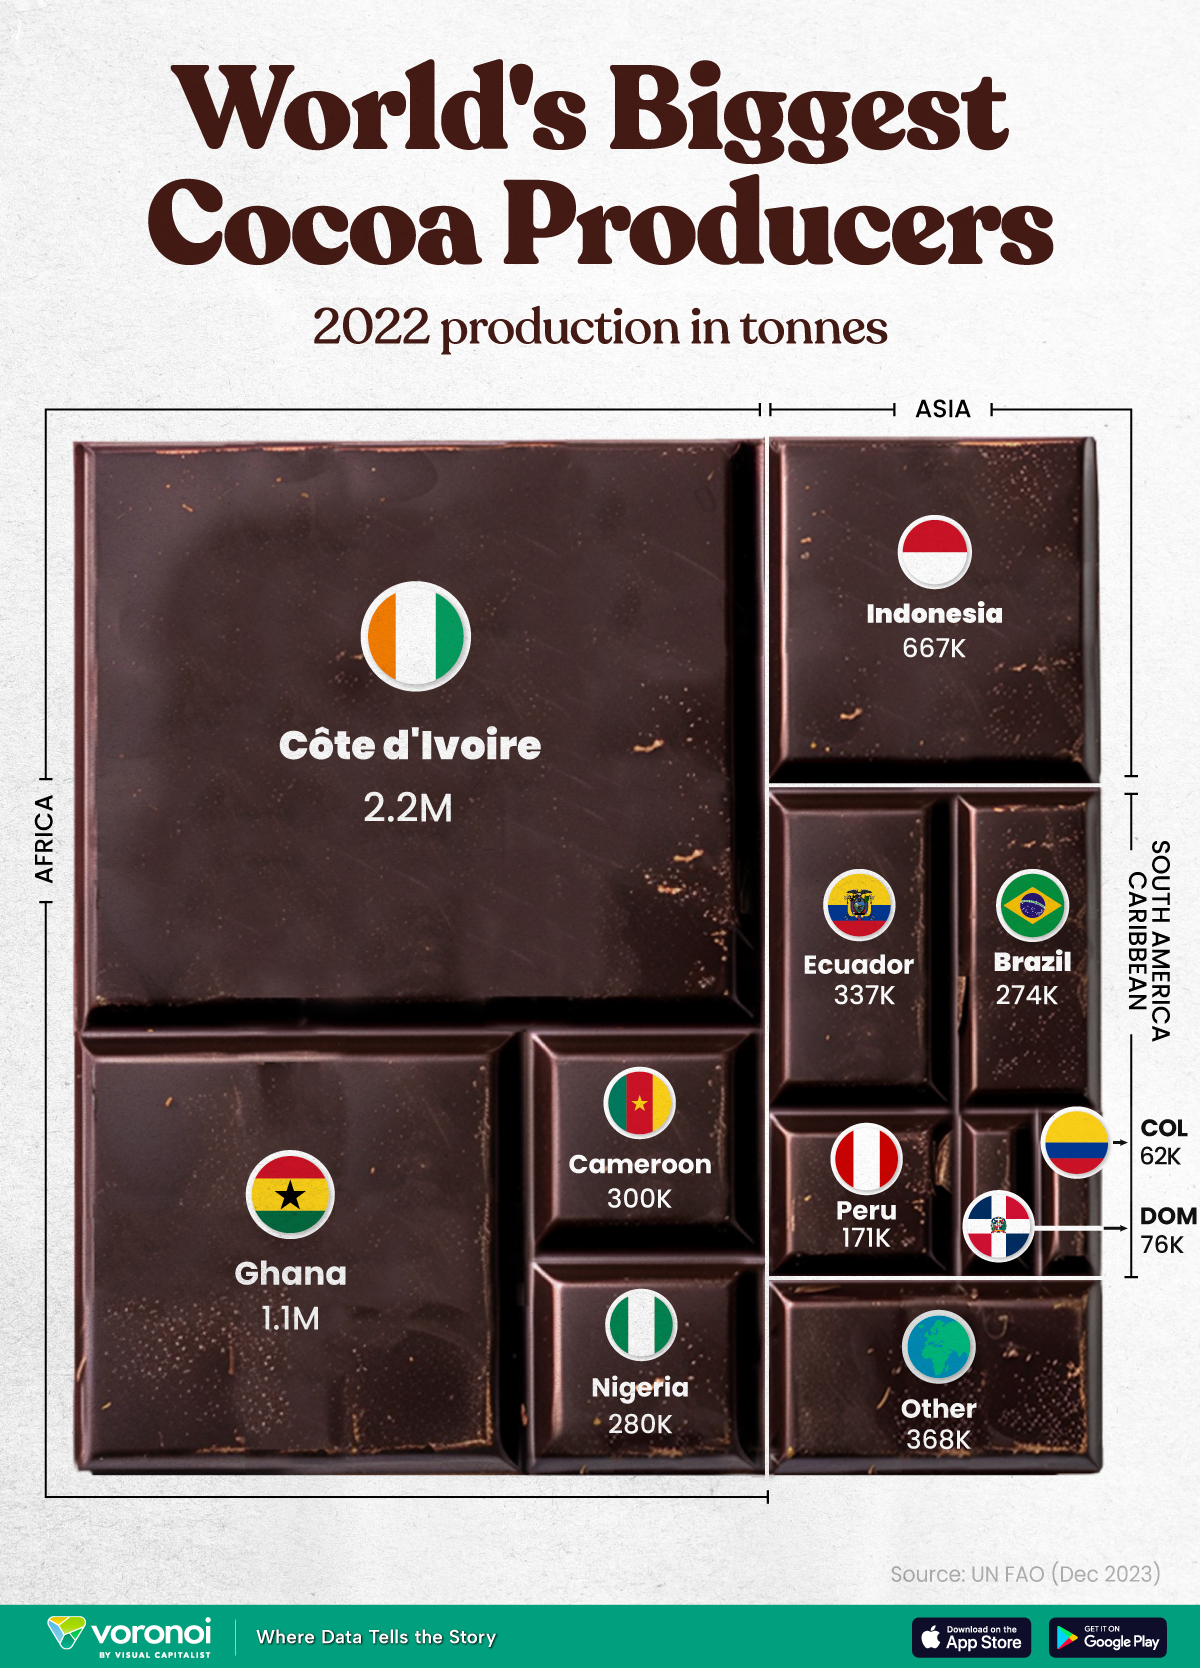
Here are the largest cocoa producing countries globally—from Côte d’Ivoire to Brazil—as cocoa prices hit record highs.
The World’s Top Cocoa Producing Countries
This was originally posted on our Voronoi app. Download the app for free on iOS or Android and discover incredible data-driven charts from a variety of trusted sources.
West Africa is home to the largest cocoa producing countries worldwide, with 3.9 million tonnes of production in 2022.
In fact, there are about one million farmers in Côte d’Ivoire supplying cocoa to key customers such as Nestlé, Mars, and Hershey. But the massive influence of this industry has led to significant forest loss to plant cocoa trees.
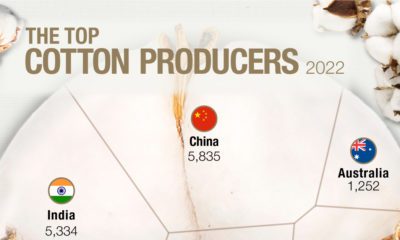
This graphic shows the leading producers of cocoa, based on data from the UN FAO.
Global Hotspots for Cocoa Production
Below, we break down the top cocoa producing countries as of 2022:
| Country | 2022 Production, Tonnes |
|---|---|
| 🇨🇮 Côte d'Ivoire | 2.2M |
| 🇬🇭 Ghana | 1.1M |
| 🇮🇩 Indonesia | 667K |
| 🇪🇨 Ecuador | 337K |
| 🇨🇲 Cameroon | 300K |
| 🇳🇬 Nigeria | 280K |
| 🇧🇷 Brazil | 274K |
| 🇵🇪 Peru | 171K |
| 🇩🇴 Dominican Republic | 76K |
| 🌍 Other | 386K |
With 2.2 million tonnes of cocoa in 2022, Côte d’Ivoire is the world’s largest producer, accounting for a third of the global total.
For many reasons, the cocoa trade in Côte d’Ivoire and Western Africa has been controversial. Often, farmers make about 5% of the retail price of a chocolate bar, and earn $1.20 each day. Adding to this, roughly a third of cocoa farms operate on forests that are meant to be protected.
As the third largest producer, Indonesia produced 667,000 tonnes of cocoa with the U.S., Malaysia, and Singapore as major importers. Overall, small-scale farmers produce 95% of cocoa in the country, but face several challenges such as low pay and unwanted impacts from climate change. Alongside aging trees in the country, these setbacks have led productivity to decline.
In South America, major producers include Ecuador and Brazil. In the early 1900s, Ecuador was the world’s largest cocoa producing country, however shifts in the global marketplace and crop disease led its position to fall. Today, the country is most known for its high-grade single-origin chocolate, with farms seen across the Amazon rainforest.
Altogether, global cocoa production reached 6.5 million tonnes, supported by strong demand. On average, the market has grown 3% annually over the last several decades.

-

 Education1 week ago
How Hard Is It to Get Into an Ivy League School?
-

 Technology2 weeks ago
Ranked: Semiconductor Companies by Industry Revenue Share
-

 Markets2 weeks ago
Ranked: The World’s Top Flight Routes, by Revenue
-

 Demographics2 weeks ago
Population Projections: The World’s 6 Largest Countries in 2075
-

 Markets2 weeks ago
The Top 10 States by Real GDP Growth in 2023
-

 Demographics2 weeks ago
The Smallest Gender Wage Gaps in OECD Countries
-

 Economy2 weeks ago
Where U.S. Inflation Hit the Hardest in March 2024
-

 Green2 weeks ago
Top Countries By Forest Growth Since 2001