Markets
Visualizing Ukraine’s Top Trading Partners and Products
![]() Subscribe to the Elements free mailing list for more like this
Subscribe to the Elements free mailing list for more like this
Visualizing Ukraine’s Top Trading Partners and Products
This was originally posted on Elements. Sign up to the free mailing list to get beautiful visualizations on natural resource megatrends in your email every week.
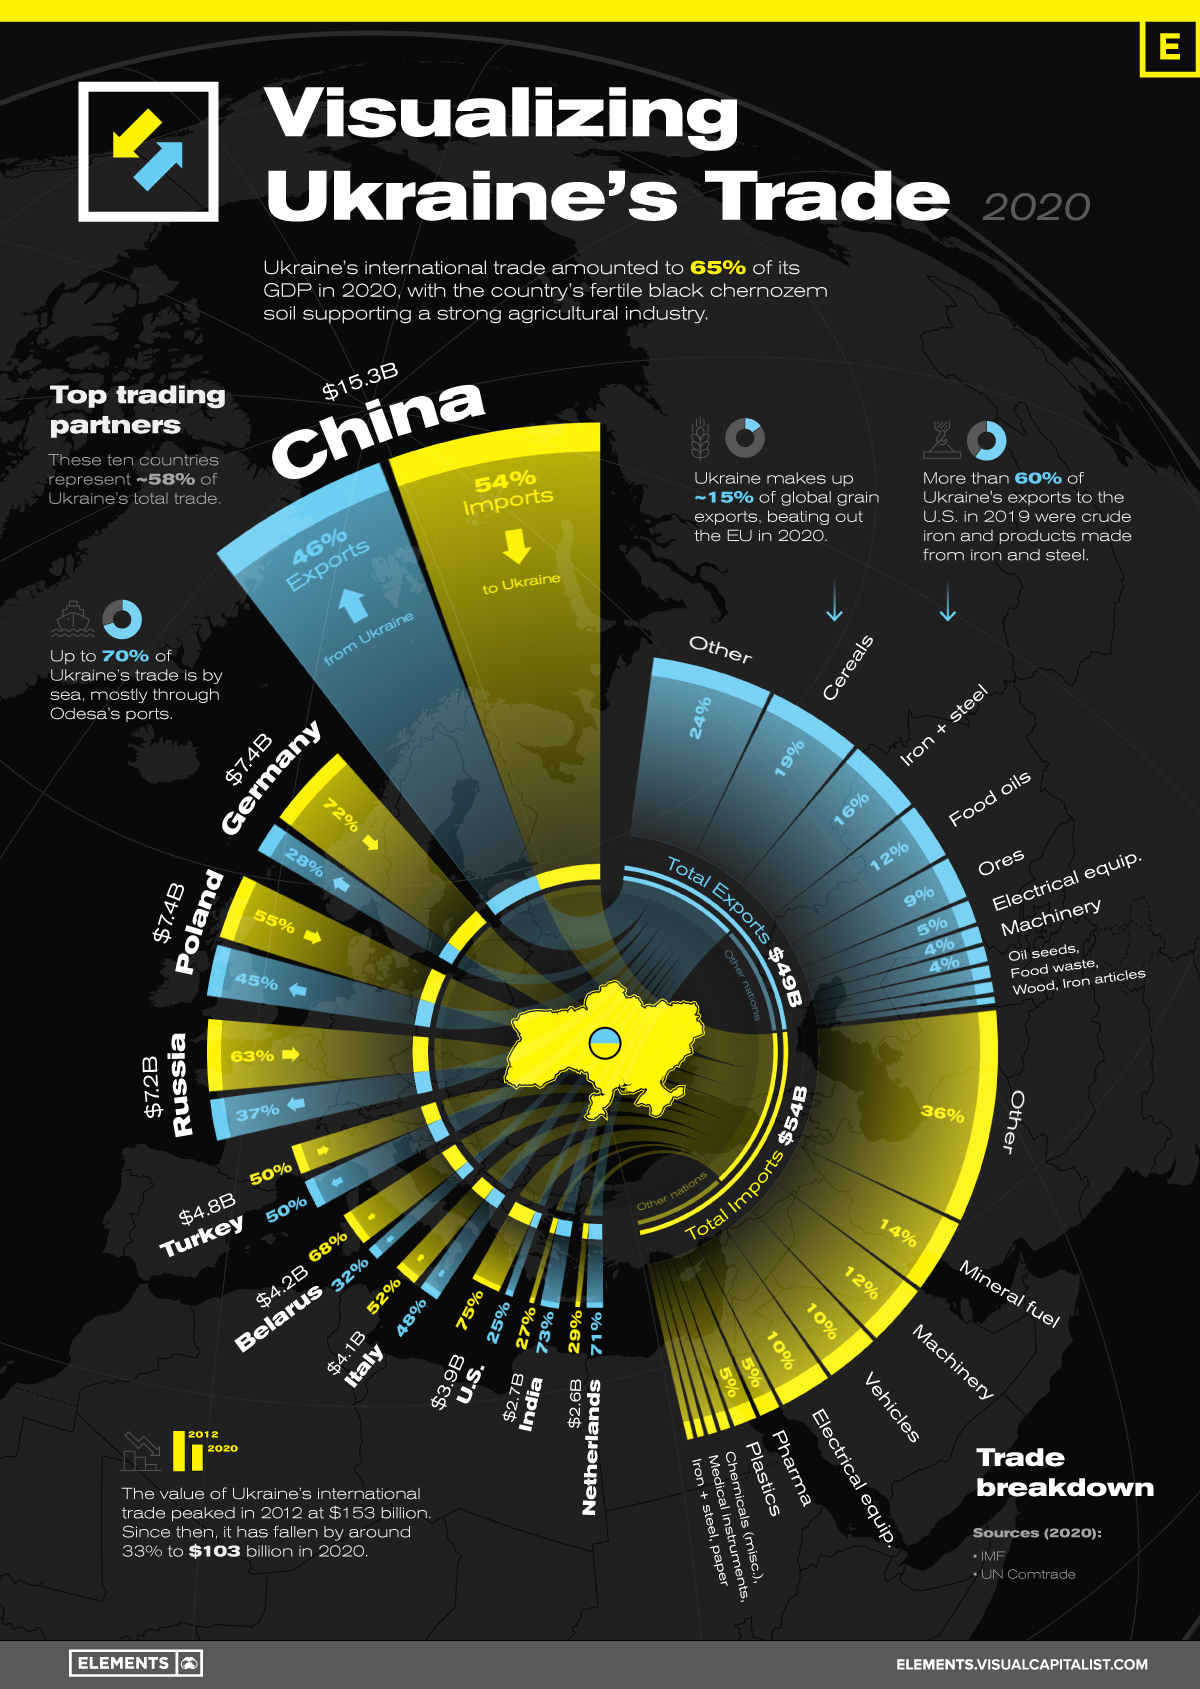
International trade was equal to 65% of Ukraine’s GDP in 2020, totaling to $102.9 billion of goods exchanged with countries around the world.
In 2014, Russia’s annexation of Crimea contributed to a 30% year-over-year drop in Ukraine’s 2015 trade value ($75.6B). Now, Ukraine’s international trade has been irreversibly disrupted since Russia’s full-scale invasion on February 24th, 2022.
The current conflict continues to reshape geopolitical relations and international trade—and to give context to the situation, we’ve created this graphic using IMF and UN Comtrade data to showcase Ukraine’s largest trading partners and goods traded in 2020.
Ukraine’s Largest Trading Partners
Ukraine’s largest trading partner in 2020 was China, with the value of trade between the two countries reaching $15.3 billion, more than double the value of any other trading partner.
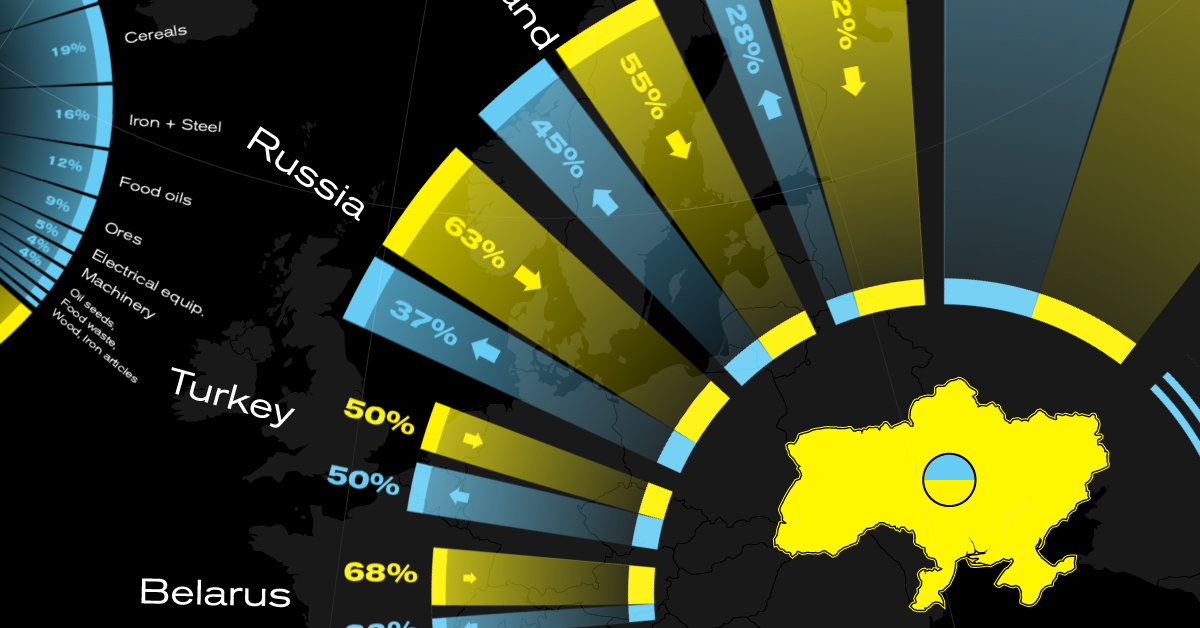
Germany ($7.4B), Poland ($7.4B), and Russia ($7.2B) were Ukraine’s next three largest trading partners, with the majority of Ukraine’s trade with these countries being imports.
| Country | Trade with Ukraine (2020) | Exports from Ukraine (%) | Imports to Ukraine (%) |
|---|---|---|---|
| 🇨🇳 China | $15.3B | 46% | 54% |
| 🇩🇪 Germany | $7.4B | 28% | 72% |
| 🇵🇱 Poland | $7.4B | 45% | 55% |
| 🇷🇺 Russia | $7.2B | 37% | 63% |
| 🇹🇷 Turkey | $4.8B | 50% | 50% |
| 🇧🇾 Belarus | $4.2B | 32% | 68% |
| 🇮🇹 Italy | $4.1B | 48% | 52% |
| 🇺🇸 U.S. | $3.9B | 25% | 75% |
| 🇮🇳 India | $2.7B | 73% | 27% |
| 🇳🇱 Netherlands | $2.6B | 71% | 29% |
Source: IMF
While most of Ukraine’s trade with top partners is made up of imports, trade with both India and the Netherlands (Ukraine’s ninth and tenth largest trading partners respectively) was more export driven, with exports holding a greater than 70% share of total trade value.
Ukraine’s Top Exports and Imports
Ukraine’s strong agricultural industry makes up a large share of the country’s exports in the form of cereals, animal and vegetable oils, and seed oils. These products made up nearly 35% of Ukraine’s exports in 2020, at a value of $17 billion collectively.
| Goods Exported from Ukraine (2020) | Dollar Value | Share of Exports |
|---|---|---|
| Cereals | $9.4B | 19.1% |
| Iron and steel | $7.7B | 15.6% |
| Animal or vegetable fats, oils, and other products | $5.8B | 11.7% |
| Ores, slag, and ash | $4.4B | 8.9% |
| Electrical machinery and equipment | $2.6B | 5.2% |
| Other goods | $19.4B | 39.5% |
Source: UN Comtrade
The other two cornerstones of Ukraine’s industry and exports are iron ore and steel, along with refined electrical machinery, equipment, and other mechanical appliances. In 2020, exports of crude iron and steel along with their refined products made up $13 billion in value, making up more than a quarter of Ukraine’s exports.
Ukraine’s imports are primarily vehicles, machinery, and the fuels necessary to power these goods. With the country’s energy consumption outpacing domestic energy production, mineral fuels and oils are Ukraine’s top import in 2020 at $7.42 billion.
| Goods Imported from Ukraine (2020) | Dollar Value | Share of Imports |
|---|---|---|
| Mineral fuels, oil, and mineral products | $7.4B | 13.8% |
| Boilers, machinery and mechanical appliances | $6.3B | 11.7% |
| Vehicles other than railway or tramway rolling stock | $5.5B | 10.2% |
| Electrical machinery and equipment | $5.3B | 9.9% |
| Pharmaceutical products | $2.5B | 4.7% |
| Other goods | $26.6B | 49.7% |
Source: UN Comtrade
Primarily importing from Belarus, Russia, and Germany, Ukraine’s need for energy fuels was greatly exacerbated by Russia’s annexation of the Crimean peninsula, which held 80% of Ukraine’s oil and natural gas deposits in the Black Sea.
Various kinds of machinery, vehicles, and electrical equipment are the next largest categories of goods imported, cumulatively making up 31% ($17.1B) of Ukraine’s imports.
Ukraine’s Shift Away from Russian Trade Dependence
Since its independence from the former USSR in 1991, Ukraine has steadily shifted towards Western trading partners, especially as conflicts with Russia escalated in the 2010s.
After years of negotiations, Ukraine’s Association Agreement with the EU in 2014 facilitated free trade between EU nations and Ukraine, reducing the country’s dependence on trade with Russia.
Ukraine is one of the most important economic centers of the former Soviet Union, and it had long been the breadbasket of the USSR thanks to its fertile chernozem soil and strong agricultural industry.
Trade value between Russia and Ukraine peaked in 2011 at $49.2 billion, and since then has fallen by 85% to $7.2 billion in 2020. During this time, European nations like Poland and Germany overtook Russia in terms of trade value with Ukraine, and in 2021 trade with the EU totaled to more than $58 billion.
War’s Effect on Ukraine’s Future Trading Partners
Russia’s invasion of Ukraine is rapidly reshaping both countries’ international relations and trading partners.
Four days into the recent conflict, Ukrainian President Zelenskyy filed for Ukraine’s special admission into the EU, which would further strengthen Ukraine’s trade with European Union members. Combining the likely breakdown of Ukrainian-Russian trade with China’s lack of condemnation of Russia’s actions, Ukraine’s trade seems likely to continue shifting towards the European Union and its Western allies.
While not exactly international trade, on February 26th the U.S. committed an additional $350 million in support to Ukraine, with American financial security assistance to Ukraine totaling $1 billion over the past year. Alongside the U.S., the EU recently committed €500 million in financial support, and multiple EU and non-EU nations are providing Ukraine with military aid.
Although it’s impossible to determine the results of this conflict and its effects on international trade, the countries supporting Ukraine’s defense today are likely to become the Ukraine’s top trading partners in the future.


Markets
U.S. Debt Interest Payments Reach $1 Trillion
U.S. debt interest payments have surged past the $1 trillion dollar mark, amid high interest rates and an ever-expanding debt burden.


U.S. Debt Interest Payments Reach $1 Trillion
This was originally posted on our Voronoi app. Download the app for free on iOS or Android and discover incredible data-driven charts from a variety of trusted sources.
The cost of paying for America’s national debt crossed the $1 trillion dollar mark in 2023, driven by high interest rates and a record $34 trillion mountain of debt.
Over the last decade, U.S. debt interest payments have more than doubled amid vast government spending during the pandemic crisis. As debt payments continue to soar, the Congressional Budget Office (CBO) reported that debt servicing costs surpassed defense spending for the first time ever this year.
This graphic shows the sharp rise in U.S. debt payments, based on data from the Federal Reserve.
A $1 Trillion Interest Bill, and Growing
Below, we show how U.S. debt interest payments have risen at a faster pace than at another time in modern history:
| Date | Interest Payments | U.S. National Debt |
|---|---|---|
| 2023 | $1.0T | $34.0T |
| 2022 | $830B | $31.4T |
| 2021 | $612B | $29.6T |
| 2020 | $518B | $27.7T |
| 2019 | $564B | $23.2T |
| 2018 | $571B | $22.0T |
| 2017 | $493B | $20.5T |
| 2016 | $460B | $20.0T |
| 2015 | $435B | $18.9T |
| 2014 | $442B | $18.1T |
| 2013 | $425B | $17.2T |
| 2012 | $417B | $16.4T |
| 2011 | $433B | $15.2T |
| 2010 | $400B | $14.0T |
| 2009 | $354B | $12.3T |
| 2008 | $380B | $10.7T |
| 2007 | $414B | $9.2T |
| 2006 | $387B | $8.7T |
| 2005 | $355B | $8.2T |
| 2004 | $318B | $7.6T |
| 2003 | $294B | $7.0T |
| 2002 | $298B | $6.4T |
| 2001 | $318B | $5.9T |
| 2000 | $353B | $5.7T |
| 1999 | $353B | $5.8T |
| 1998 | $360B | $5.6T |
| 1997 | $368B | $5.5T |
| 1996 | $362B | $5.3T |
| 1995 | $357B | $5.0T |
| 1994 | $334B | $4.8T |
| 1993 | $311B | $4.5T |
| 1992 | $306B | $4.2T |
| 1991 | $308B | $3.8T |
| 1990 | $298B | $3.4T |
| 1989 | $275B | $3.0T |
| 1988 | $254B | $2.7T |
| 1987 | $240B | $2.4T |
| 1986 | $225B | $2.2T |
| 1985 | $219B | $1.9T |
| 1984 | $205B | $1.7T |
| 1983 | $176B | $1.4T |
| 1982 | $157B | $1.2T |
| 1981 | $142B | $1.0T |
| 1980 | $113B | $930.2B |
| 1979 | $96B | $845.1B |
| 1978 | $84B | $789.2B |
| 1977 | $69B | $718.9B |
| 1976 | $61B | $653.5B |
| 1975 | $55B | $576.6B |
| 1974 | $50B | $492.7B |
| 1973 | $45B | $469.1B |
| 1972 | $39B | $448.5B |
| 1971 | $36B | $424.1B |
| 1970 | $35B | $389.2B |
| 1969 | $30B | $368.2B |
| 1968 | $25B | $358.0B |
| 1967 | $23B | $344.7B |
| 1966 | $21B | $329.3B |
Interest payments represent seasonally adjusted annual rate at the end of Q4.
At current rates, the U.S. national debt is growing by a remarkable $1 trillion about every 100 days, equal to roughly $3.6 trillion per year.
As the national debt has ballooned, debt payments even exceeded Medicaid outlays in 2023—one of the government’s largest expenditures. On average, the U.S. spent more than $2 billion per day on interest costs last year. Going further, the U.S. government is projected to spend a historic $12.4 trillion on interest payments over the next decade, averaging about $37,100 per American.
Exacerbating matters is that the U.S. is running a steep deficit, which stood at $1.1 trillion for the first six months of fiscal 2024. This has accelerated due to the 43% increase in debt servicing costs along with a $31 billion dollar increase in defense spending from a year earlier. Additionally, a $30 billion increase in funding for the Federal Deposit Insurance Corporation in light of the regional banking crisis last year was a major contributor to the deficit increase.
Overall, the CBO forecasts that roughly 75% of the federal deficit’s increase will be due to interest costs by 2034.

-

 Real Estate2 weeks ago
Visualizing America’s Shortage of Affordable Homes
-

 Technology1 week ago
Ranked: Semiconductor Companies by Industry Revenue Share
-

 Money1 week ago
Which States Have the Highest Minimum Wage in America?
-

 Real Estate1 week ago
Ranked: The Most Valuable Housing Markets in America
-

 Business2 weeks ago
Charted: Big Four Market Share by S&P 500 Audits
-

 AI2 weeks ago
The Stock Performance of U.S. Chipmakers So Far in 2024
-

 Misc2 weeks ago
Almost Every EV Stock is Down After Q1 2024
-

 Money2 weeks ago
Where Does One U.S. Tax Dollar Go?