Agriculture
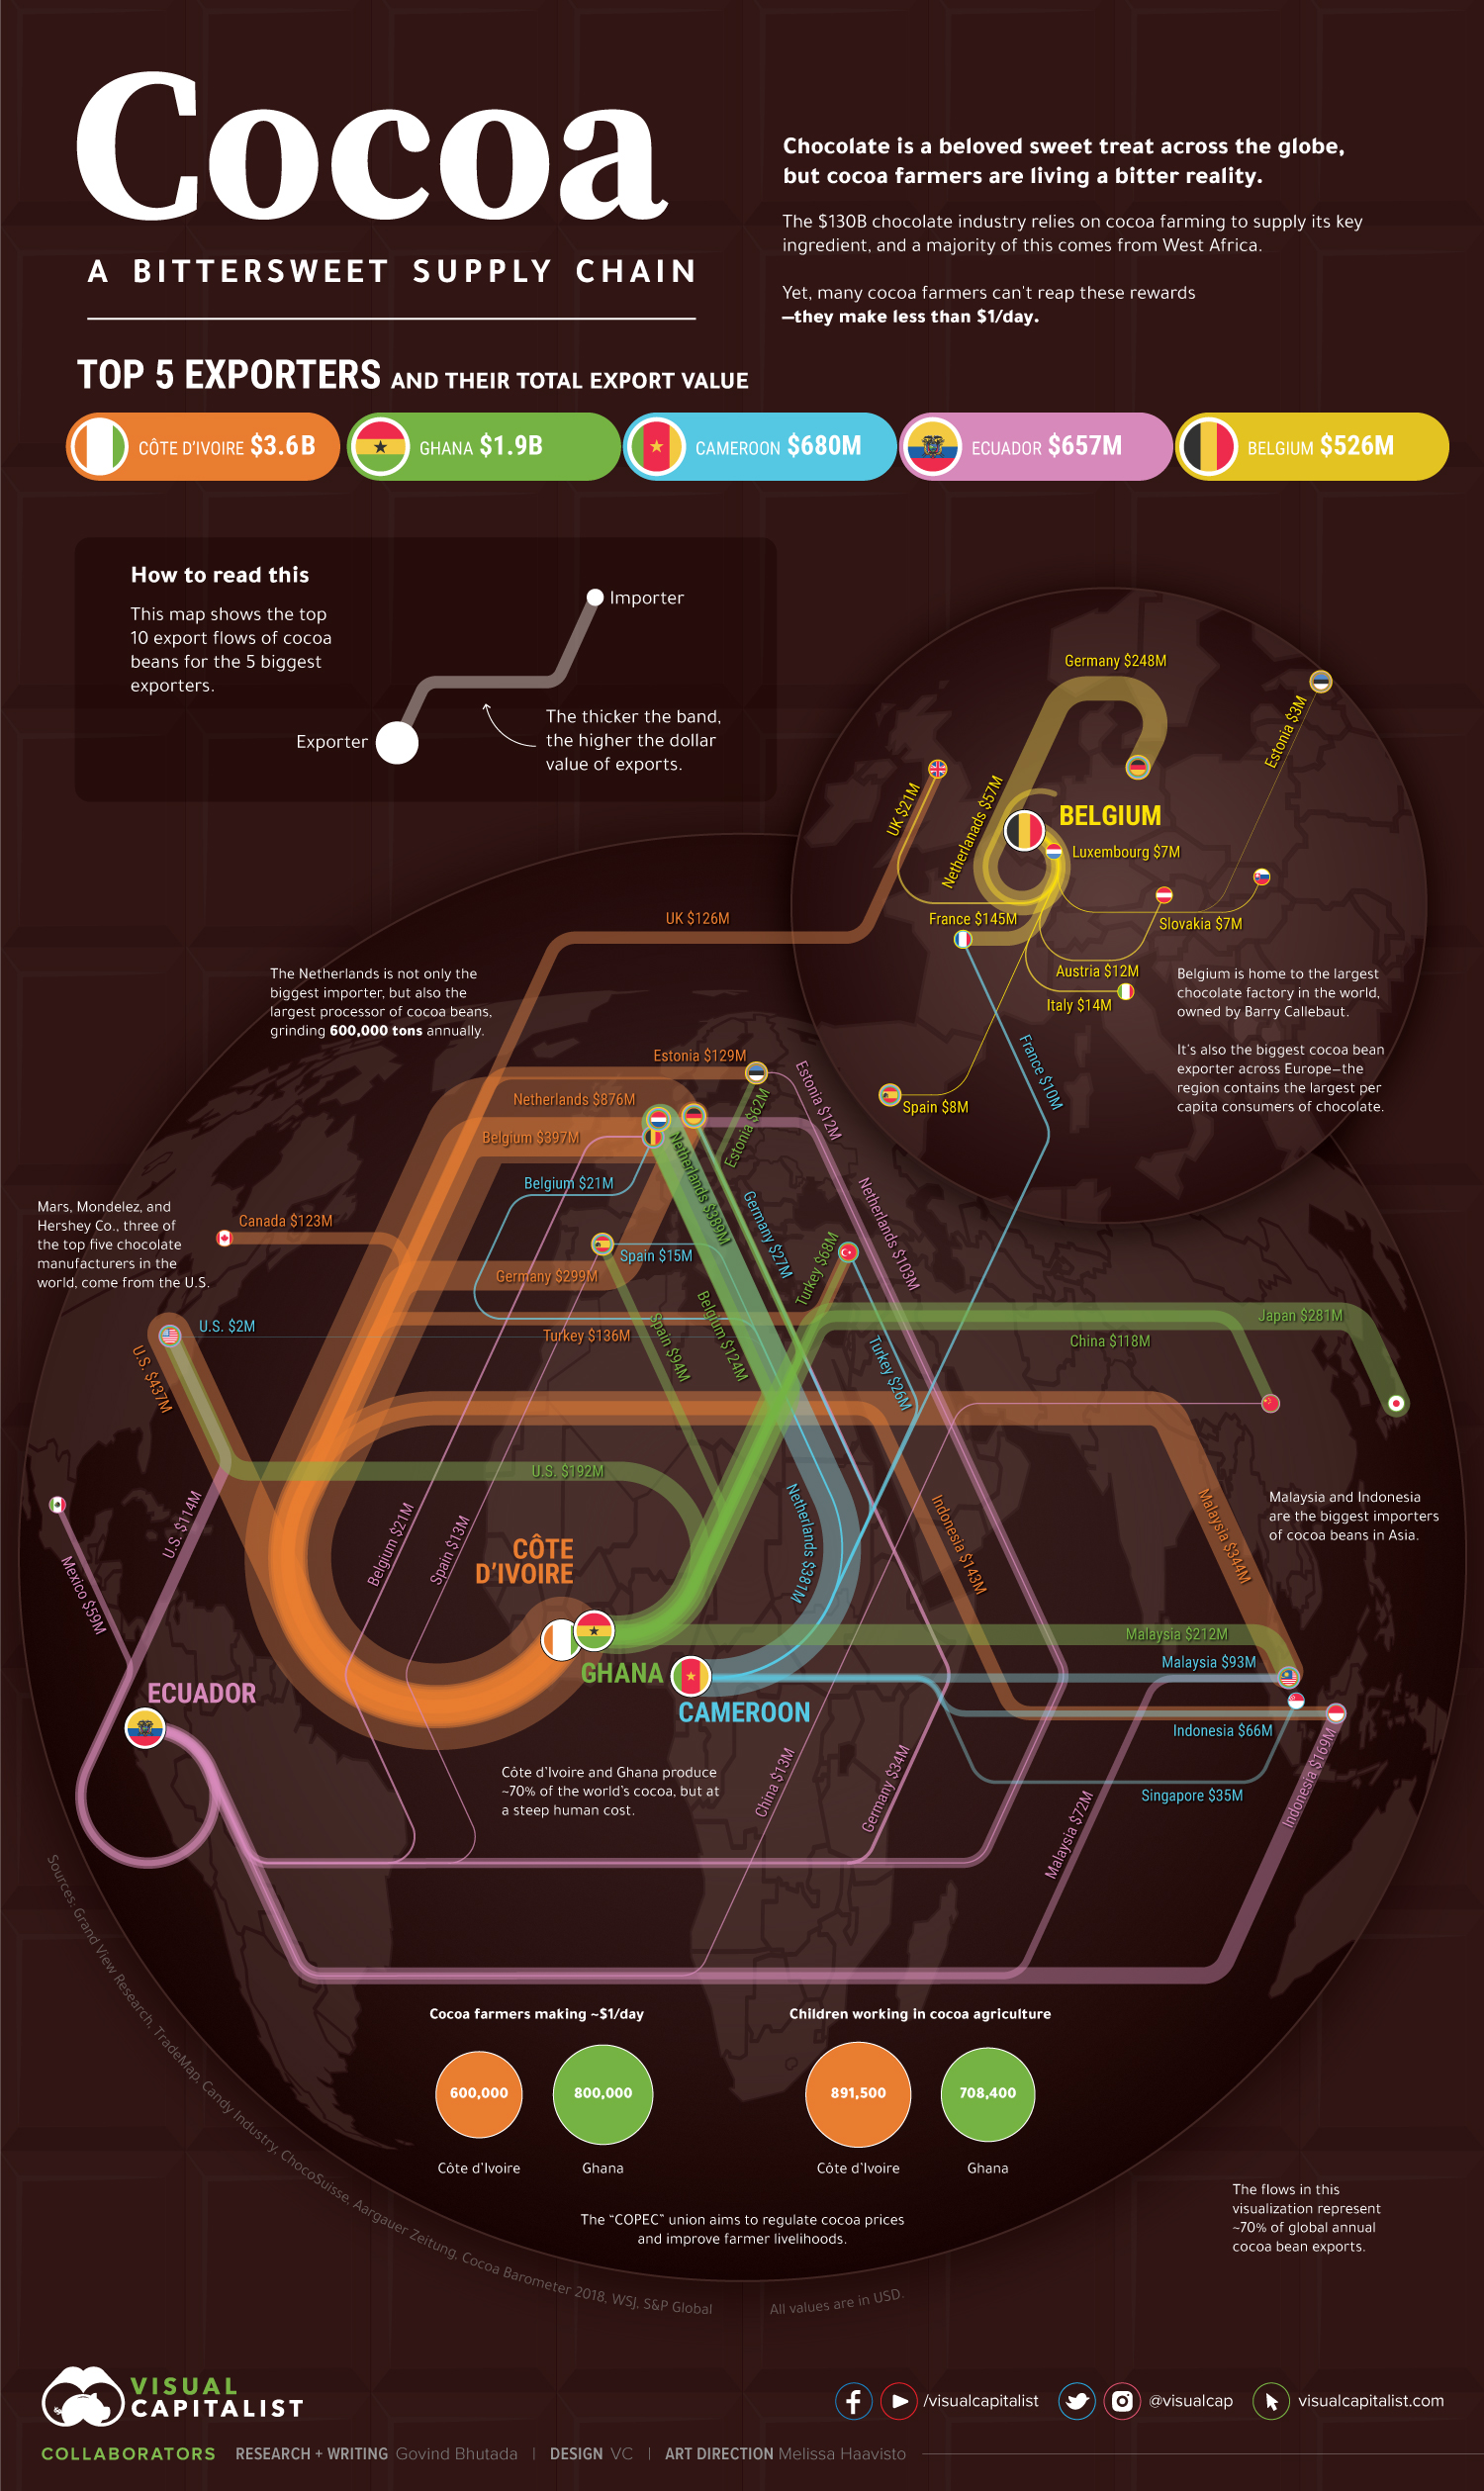
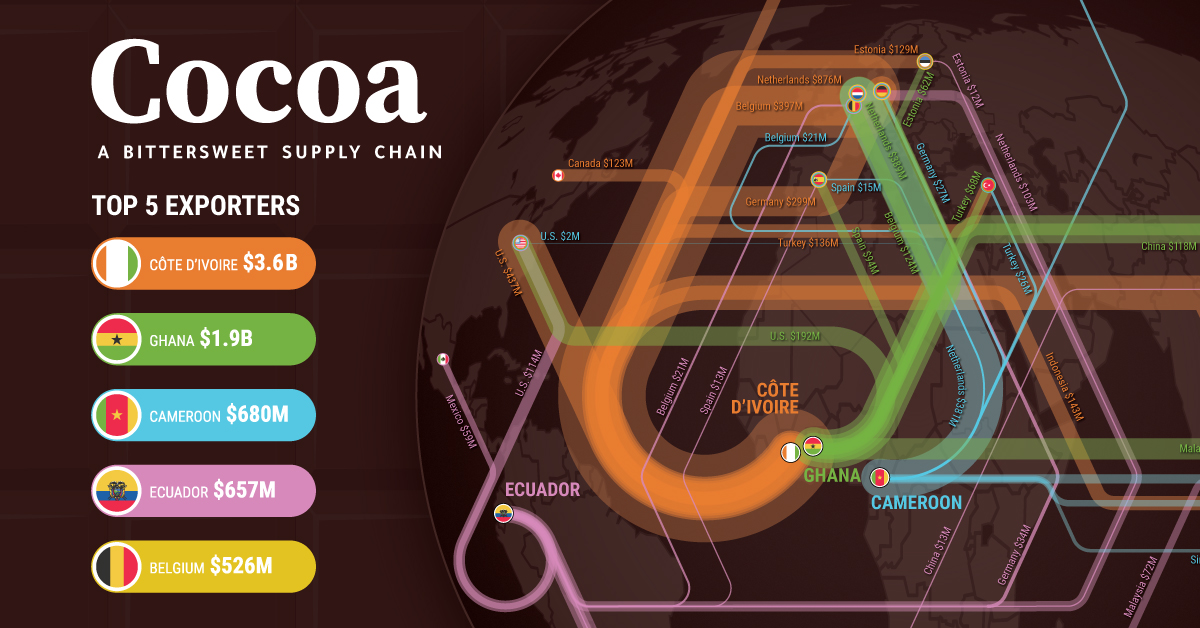
Cocoa: A Bittersweet Supply Chain
Click to view a larger version of this infographic


Cocoa: A Bittersweet Supply Chain
From bean to bar, the cocoa supply chain is a bittersweet one. While the end product is something most of us enjoy, this also comes with a human cost.
Based on how much cocoa comes from West Africa, it’s likely that most of the chocolates we eat have a little bit of Cote d’Ivoire and Ghana in them. The $130B chocolate industry relies on cocoa farming for supply of chocolate’s key ingredient. Yet, many cocoa farmers make less than $1/day.
The above graphic maps the major trade flows of cocoa and allows us to dive deeper into its global supply chain.
From Bean to Bar: Stages in the Cocoa Supply Chain
Cocoa beans go through a number of stages before being used in chocolate products.
- Harvesting, Fermenting, and Drying
First, farmers harvest cocoa beans from pods on cacao plants. Next, they are fermented in heaps and covered with banana leaves. Farmers then dry and package the cocoa beans for domestic transportation. - Domestic Transportation, Cleaning, and Exporting
Domestic transporters carry packaged cocoa beans to either cleaning warehouses or processing factories. Cocoa beans are cleaned and prepared for exports to the chocolate production hubs of the world. - Processing and Chocolate Production
Processing companies winnow, roast, and grind cocoa beans and then convert them into cocoa liquor, cocoa butter, or cocoa cakes—which are mixed with other ingredients like sugar and milk to produce chocolate products.
Cocoa farming and trade are at the roots of the chocolate industry, and the consistent supply of cocoa plays a critical role in providing us with reasonably-priced chocolate.
So where exactly does all this cocoa come from?
The Key Nations in Cocoa’s Global Supply Chain
Growing cocoa has specific temperature, water, and humidity requirements. As a result, the equatorial regions of Africa, Central and South America, and Asia are optimal for cocoa farming.
These regions host the biggest cocoa exporters by value.
| Rank (2019) | Exporting Country | Value (US$, millions) |
|---|---|---|
| 1 | Côte d’Ivoire 🇨🇮 | $3,575 |
| 2 | Ghana 🇬🇭 | $1,851 |
| 3 | Cameroon 🇨🇲 | $680 |
| 4 | Ecuador 🇪🇨 | $657 |
| 5 | Belgium 🇧🇪 | $526 |
Côte d’Ivoire and Ghana are responsible for 70% of global cocoa production, and cocoa exports play a huge role in their economies. Although the majority of exporters come from equatorial regions, Belgium stands out in fifth place.
On the other hand, most of the top importers are in Europe—the Netherlands and Germany being the top two.
| Rank (2019) | Importing Country | Value (US$, millions) |
|---|---|---|
| 1 | Netherlands 🇳🇱 | $2,283 |
| 2 | Germany 🇩🇪 | $1,182 |
| 3 | U.S. 🇺🇸 | $931 |
| 4 | Malaysia 🇲🇾 | $826 |
| 5 | Belgium 🇧🇪 | $719 |
In third place, the U.S. primarily sources its cocoa from Côte d’Ivoire, Ghana, and Ecuador. Mars, Hershey, Cargill, and Blommer—some of the world’s biggest chocolate manufacturers and processors—are headquartered in the U.S.
Finally, it comes as no surprise that the biggest importers of cocoa beans are among the biggest chocolate exporters.
| Rank (2019) | Country | Value of Chocolate Exports (US$, millions) |
|---|---|---|
| 1 | Germany 🇩🇪 | $4,924 |
| 2 | Belgium 🇧🇪 | $3,143 |
| 3 | Italy 🇮🇹 | $2,100 |
| 4 | Netherlands 🇳🇱 | $1,992 |
| 5 | Poland 🇵🇱 | $1,834 |
Not only is the Netherlands the biggest importer of beans, but it’s also the biggest processor—grinding 600,000 tons annually—and the fourth largest exporter of chocolate products.
Belgium is another key nation in the supply chain, importing cocoa beans from producing countries and exporting them across Europe. It’s also home to the world’s largest chocolate factory, supporting its annual chocolate exports worth $3.1 billion.
Breaking Down the Cocoa Supply Chain: Who Gets What
Without farmers, both the cocoa and chocolate industries are likely to suffer from shortages, with domino effects on higher overall costs. Yet, they have little ability to influence prices at present.
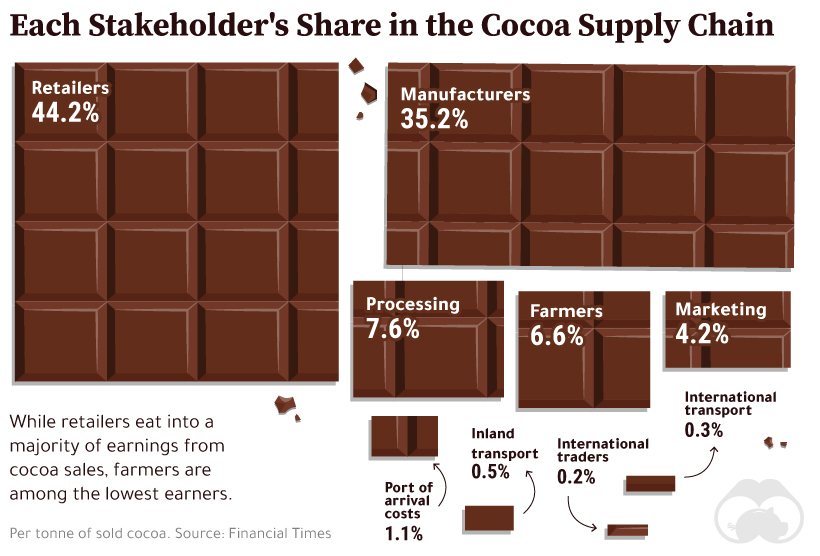
Farmers are among the lowest earners from a tonne of sold cocoa—accounting for just 6.6% of the value of the final sale.
Low incomes also translate into numerous other issues associated with cocoa farming.
The Bitter Side of Cocoa Farming
The World Bank has established the threshold for extreme poverty at $1.90/day. Cocoa farmers in Ghana make $1/day, while those in Côte d’Ivoire make around $0.78/day—both significantly below the extreme poverty line.
Farmers are often unable to bear the costs of cocoa farming as a result of low incomes. In turn, they employ children, who miss out on education, are exposed to hazardous working conditions, and get paid little or no wages.
| Country | Cocoa Farmers Making $1/day or less | Children in Cocoa Agriculture |
|---|---|---|
| Côte d’Ivoire 🇨🇮 | 600,000 | 891,500 |
| Ghana 🇬🇭 | 800,000 | 708,400 |
To make matters worse, cocoa farming is primarily responsible for deforestation and illegal farming in Côte d’Ivoire and Ghana—adding environmental issues to the mix.
These interconnected problems call for action, so what is being done to fight them?
Combating Cocoa’s Concerns
Mars, Nestlé, and Hershey—some of the world’s biggest chocolate manufacturers—have made several pledges to eradicate child labor in cocoa farming over the last two decades, but haven’t reached their targets.
In addition, organizations such as UTZ Certified, Rainforest Alliance, and Fairtrade are working to increase traceability in the supply chain by selling ‘certified cocoa’, sourced from farms that prohibit child labor.
More recently, Côte d’Ivoire and Ghana announced a fixed premium of US$400/tonne on cocoa futures, aiming to improve farmer livelihoods by creating a union for cocoa, also known colloquially as the “COPEC” for the industry.
While these initiatives have had some positive impacts, more still needs to be done to successfully eradicate large-scale child labor and poverty of those involved in cocoa’s bittersweet supply chain.


Agriculture
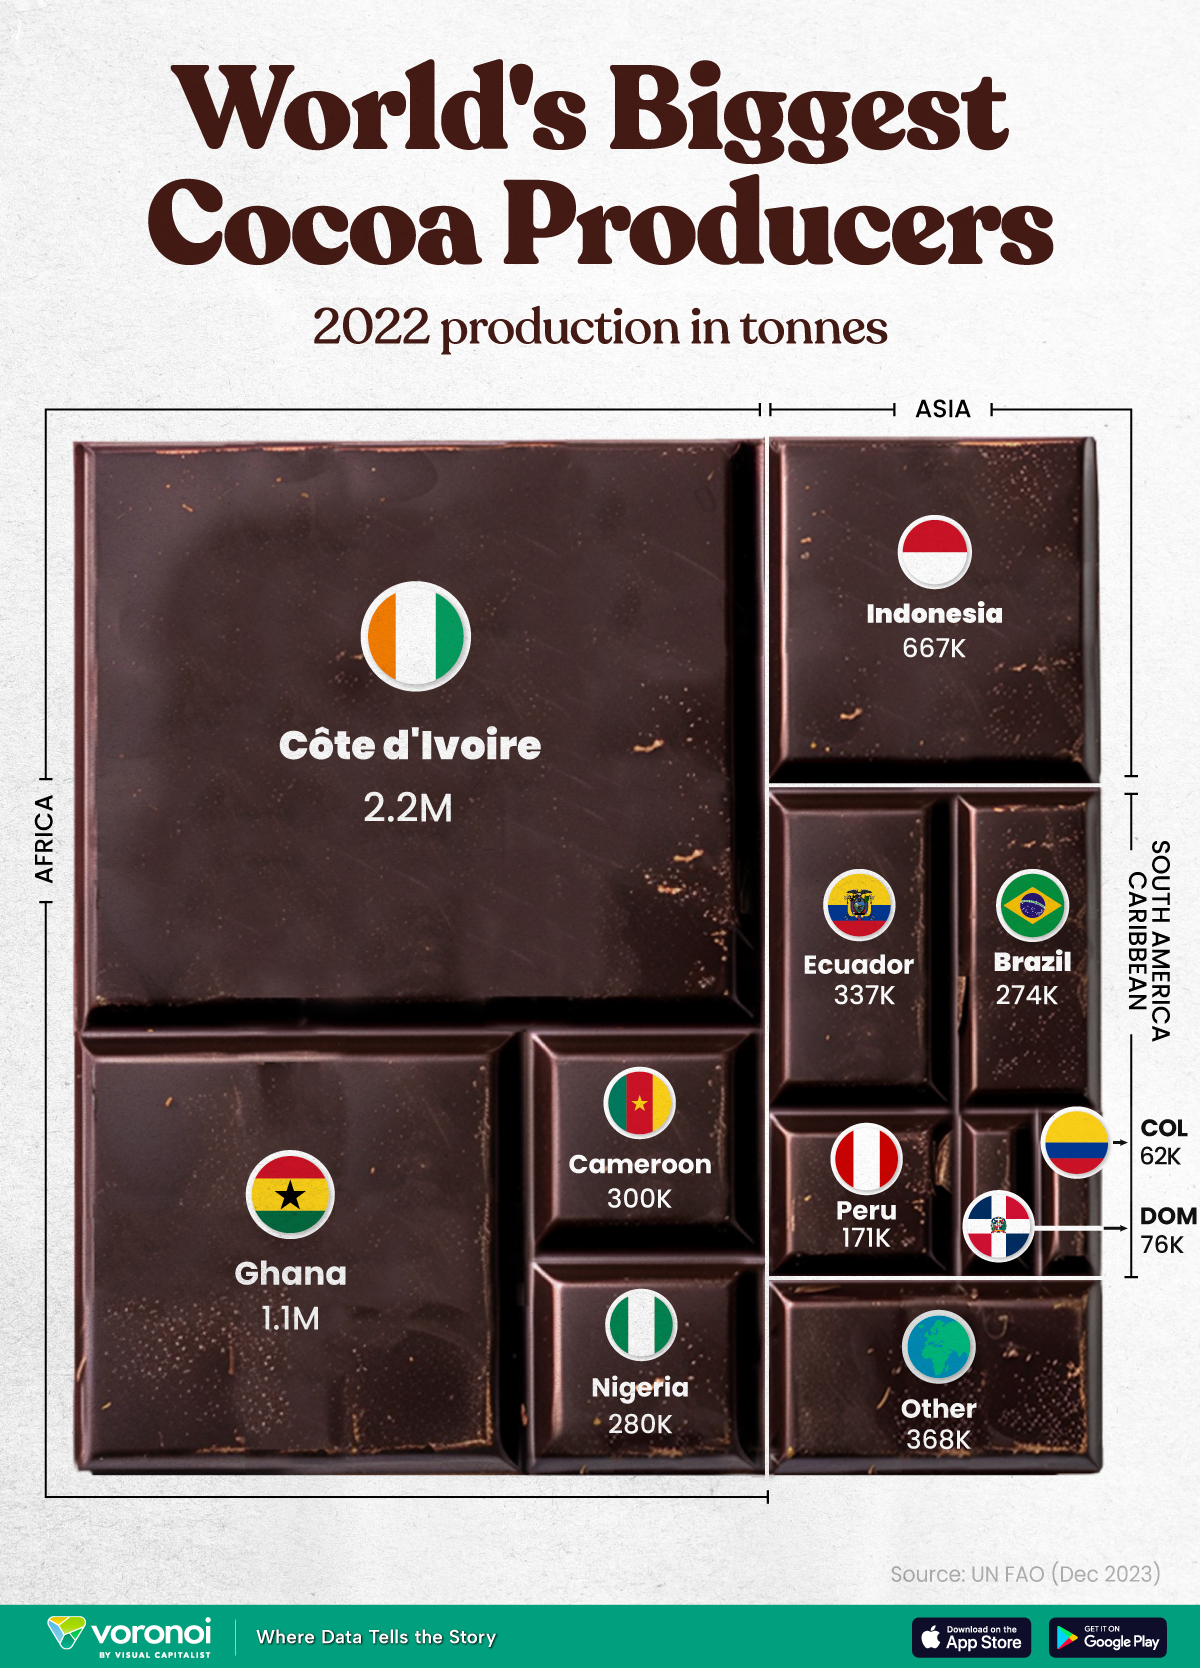
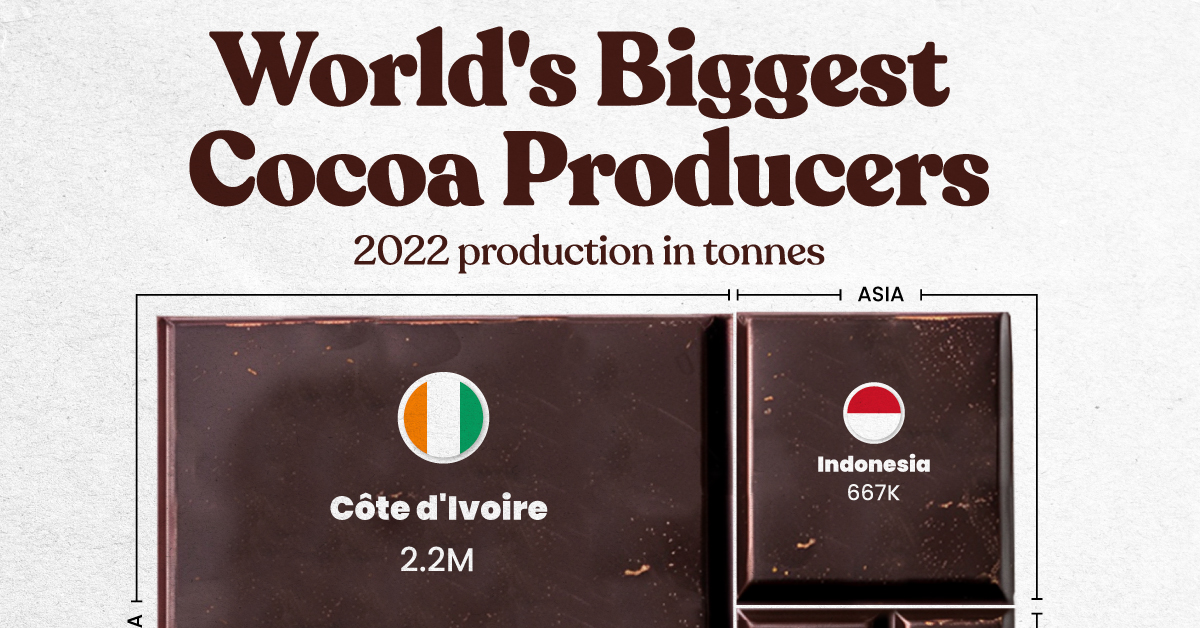
The World’s Top Cocoa Producing Countries
Here are the largest cocoa producing countries globally—from Côte d’Ivoire to Brazil—as cocoa prices hit record highs.
The World’s Top Cocoa Producing Countries
This was originally posted on our Voronoi app. Download the app for free on iOS or Android and discover incredible data-driven charts from a variety of trusted sources.
West Africa is home to the largest cocoa producing countries worldwide, with 3.9 million tonnes of production in 2022.
In fact, there are about one million farmers in Côte d’Ivoire supplying cocoa to key customers such as Nestlé, Mars, and Hershey. But the massive influence of this industry has led to significant forest loss to plant cocoa trees.
This graphic shows the leading producers of cocoa, based on data from the UN FAO.
Global Hotspots for Cocoa Production
Below, we break down the top cocoa producing countries as of 2022:
| Country | 2022 Production, Tonnes |
|---|---|
| 🇨🇮 Côte d'Ivoire | 2.2M |
| 🇬🇭 Ghana | 1.1M |
| 🇮🇩 Indonesia | 667K |
| 🇪🇨 Ecuador | 337K |
| 🇨🇲 Cameroon | 300K |
| 🇳🇬 Nigeria | 280K |
| 🇧🇷 Brazil | 274K |
| 🇵🇪 Peru | 171K |
| 🇩🇴 Dominican Republic | 76K |
| 🌍 Other | 386K |
With 2.2 million tonnes of cocoa in 2022, Côte d’Ivoire is the world’s largest producer, accounting for a third of the global total.
For many reasons, the cocoa trade in Côte d’Ivoire and Western Africa has been controversial. Often, farmers make about 5% of the retail price of a chocolate bar, and earn $1.20 each day. Adding to this, roughly a third of cocoa farms operate on forests that are meant to be protected.
As the third largest producer, Indonesia produced 667,000 tonnes of cocoa with the U.S., Malaysia, and Singapore as major importers. Overall, small-scale farmers produce 95% of cocoa in the country, but face several challenges such as low pay and unwanted impacts from climate change. Alongside aging trees in the country, these setbacks have led productivity to decline.
In South America, major producers include Ecuador and Brazil. In the early 1900s, Ecuador was the world’s largest cocoa producing country, however shifts in the global marketplace and crop disease led its position to fall. Today, the country is most known for its high-grade single-origin chocolate, with farms seen across the Amazon rainforest.
Altogether, global cocoa production reached 6.5 million tonnes, supported by strong demand. On average, the market has grown 3% annually over the last several decades.

-

 Debt1 week ago
How Debt-to-GDP Ratios Have Changed Since 2000
-

 Markets2 weeks ago
Ranked: The World’s Top Flight Routes, by Revenue
-

 Countries2 weeks ago
Population Projections: The World’s 6 Largest Countries in 2075
-

 Markets2 weeks ago
The Top 10 States by Real GDP Growth in 2023
-

 Demographics2 weeks ago
The Smallest Gender Wage Gaps in OECD Countries
-

 United States2 weeks ago
Where U.S. Inflation Hit the Hardest in March 2024
-

 Green2 weeks ago
Top Countries By Forest Growth Since 2001
-

 United States2 weeks ago
Ranked: The Largest U.S. Corporations by Number of Employees