Cities
The 50 Highest Cities in the World


Where Are The World’s Highest Cities?
When comparing the world’s cities to one another, we often use defining characteristics—largest, greenest, most visited, highest-earning, the list goes on.
Yet elevation is often overlooked, despite the fact that thousands of cities across the globe are nestled in highlands, plateaus, and mountain ranges.
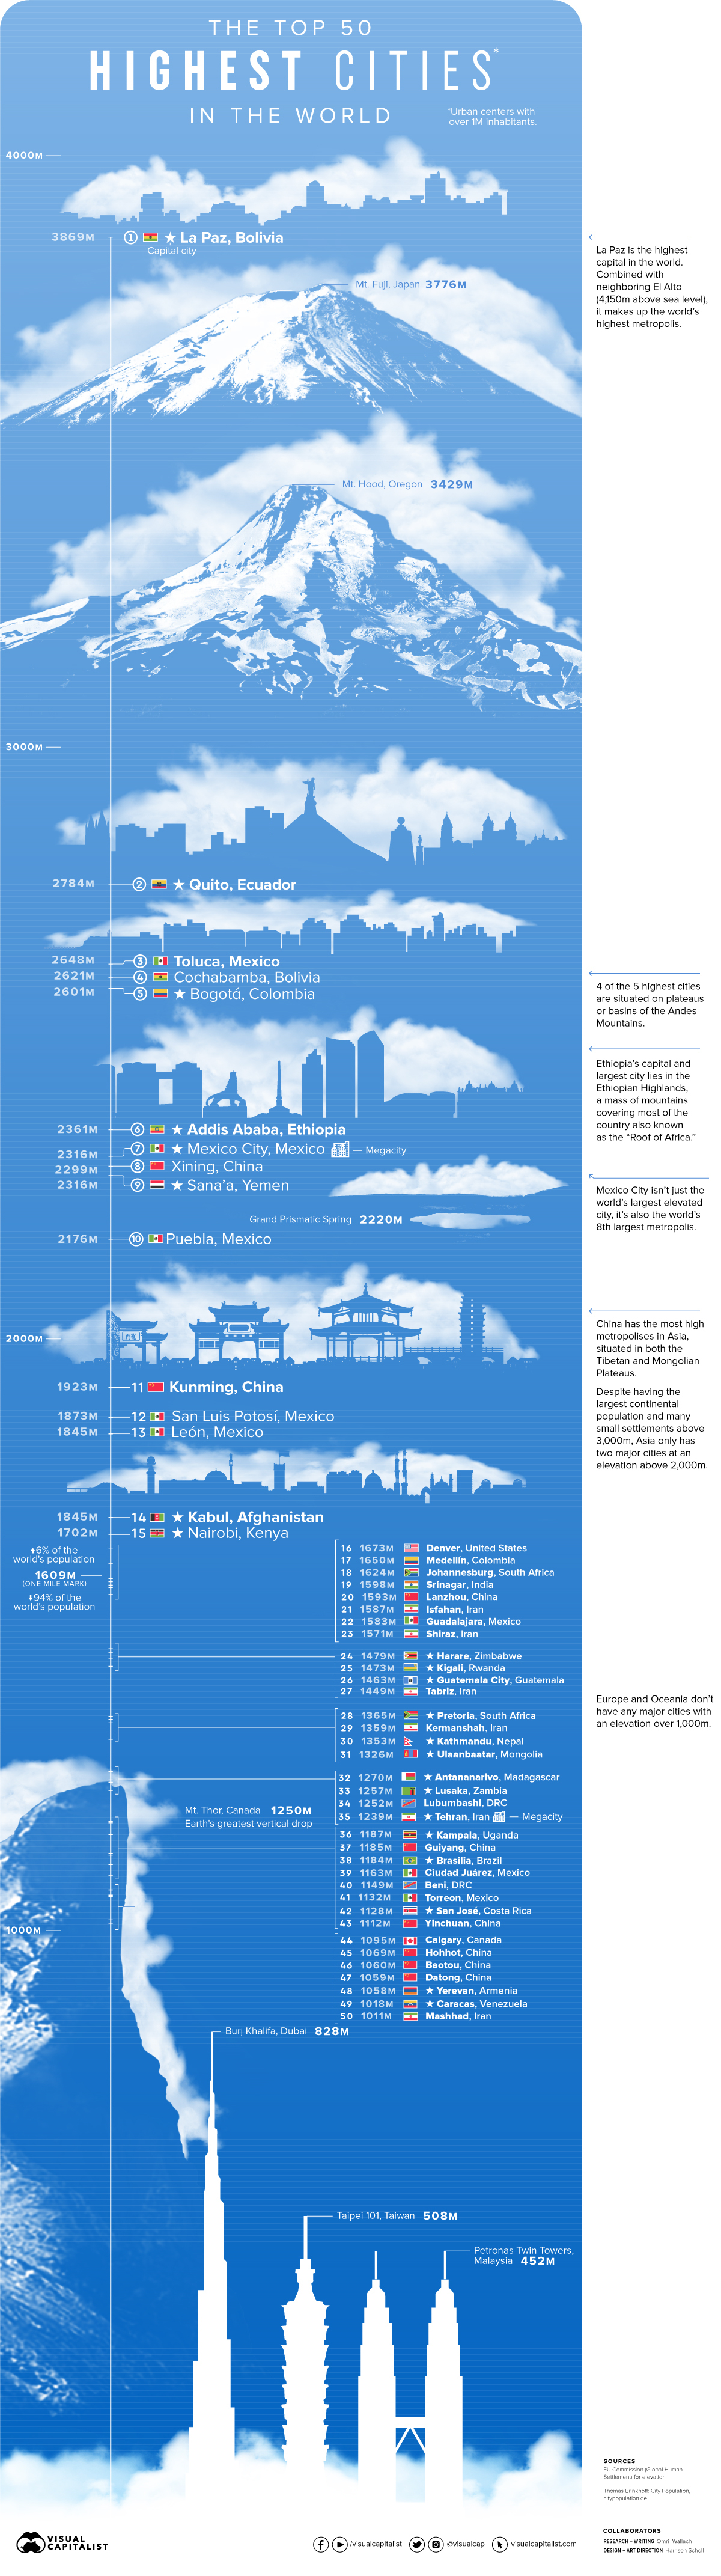
Today’s graphic looks at the top 50 highest cities worldwide, and compares their altitudes to well-known references (the differences are dizzying).
Cities in the Sky
When ranking the world’s highest cities, we specifically looked at major urban centers with a population of one million or more inhabitants, with an elevation “floor” of 1,000m.
Though you might expect less important cities to make the rankings, 22 out of the 50 highest cities are actually national capitals.
The elevation data comes from the European Commission’s database of urban centers, using Thomas Brinkhoff’s City Population dataset for updated demographics.
| Rank | Urban Center | Country | Region | Average Elevation (m) |
|---|---|---|---|---|
| #1 | La Paz | Bolivia | South America | 3,869 |
| #2 | Quito | Ecuador | South America | 2,784 |
| #3 | Toluca | Mexico | Central America | 2,648 |
| #4 | Cochabamba | Bolivia | South America | 2,621 |
| #5 | Bogota | Colombia | South America | 2,601 |
| #6 | Addis Ababa | Ethiopia | Eastern Africa | 2,361 |
| #7 | Mexico City | Mexico | Central America | 2,316 |
| #8 | Xining | China | Eastern Asia | 2,299 |
| #9 | Sana'a | Yemen | Western Asia | 2,283 |
| #10 | Puebla | Mexico | Central America | 2,176 |
| #11 | Kunming | China | Eastern Asia | 1,924 |
| #12 | San Luis Potosí | Mexico | Central America | 1,873 |
| #13 | León | Mexico | Central America | 1,845 |
| #14 | Kabul | Afghanistan | South-Central Asia | 1,845 |
| #15 | Nairobi | Kenya | Eastern Africa | 1,702 |
| #16 | Denver | United States | Northern America | 1,673 |
| #17 | Medellín | Colombia | South America | 1,651 |
| #18 | Johannesburg | South Africa | Southern Africa | 1,624 |
| #19 | Srinagar | India | South-Central Asia | 1,598 |
| #20 | Lanzhou | China | Eastern Asia | 1,594 |
| #21 | Isfahan | Iran | South-Central Asia | 1,587 |
| #22 | Guadalajara | Mexico | Central America | 1,583 |
| #23 | Shiraz | Iran | South-Central Asia | 1,571 |
| #24 | Harare | Zimbabwe | Eastern Africa | 1,479 |
| #25 | Kigali | Rwanda | Eastern Africa | 1,473 |
| #26 | Guatemala City | Guatemala | Central America | 1,463 |
| #27 | Tabriz | Iran | South-Central Asia | 1,449 |
| #28 | Pretoria | South Africa | Southern Africa | 1,365 |
| #29 | Kermanshah | Iran | South-Central Asia | 1,359 |
| #30 | Kathmandu | Nepal | South-Central Asia | 1,353 |
| #31 | Ulaanbaatar | Mongolia | Eastern Asia | 1,326 |
| #32 | Antananarivo | Madagascar | Eastern Africa | 1,271 |
| #33 | Lusaka | Zambia | Eastern Africa | 1,257 |
| #34 | Lubumbashi | Democratic Republic of the Congo | Middle Africa | 1,252 |
| #35 | Tehran | Iran | South-Central Asia | 1,239 |
| #36 | Kampala | Uganda | Eastern Africa | 1,187 |
| #37 | Guiyang | China | Eastern Asia | 1,185 |
| #38 | Brasilia | Brazil | South America | 1,184 |
| #39 | Ciudad Juárez | Mexico | Central America | 1,164 |
| #40 | Beni | Democratic Republic of the Congo | Middle Africa | 1,149 |
| #41 | Torreon | Mexico | Central America | 1,132 |
| #42 | San José | Costa Rica | Central America | 1,129 |
| #43 | Yinchuan | China | Eastern Asia | 1,113 |
| #44 | Calgary | Canada | Northern America | 1,095 |
| #45 | Hohhot | China | Eastern Asia | 1,069 |
| #46 | Baotou | China | Eastern Asia | 1,061 |
| #47 | Datong | China | Eastern Asia | 1,059 |
| #48 | Yerevan | Armenia | Western Asia | 1,058 |
| #49 | Caracas | Venezuela | South America | 1,018 |
| #50 | Mashhad | Iran | South-Central Asia | 1,011 |
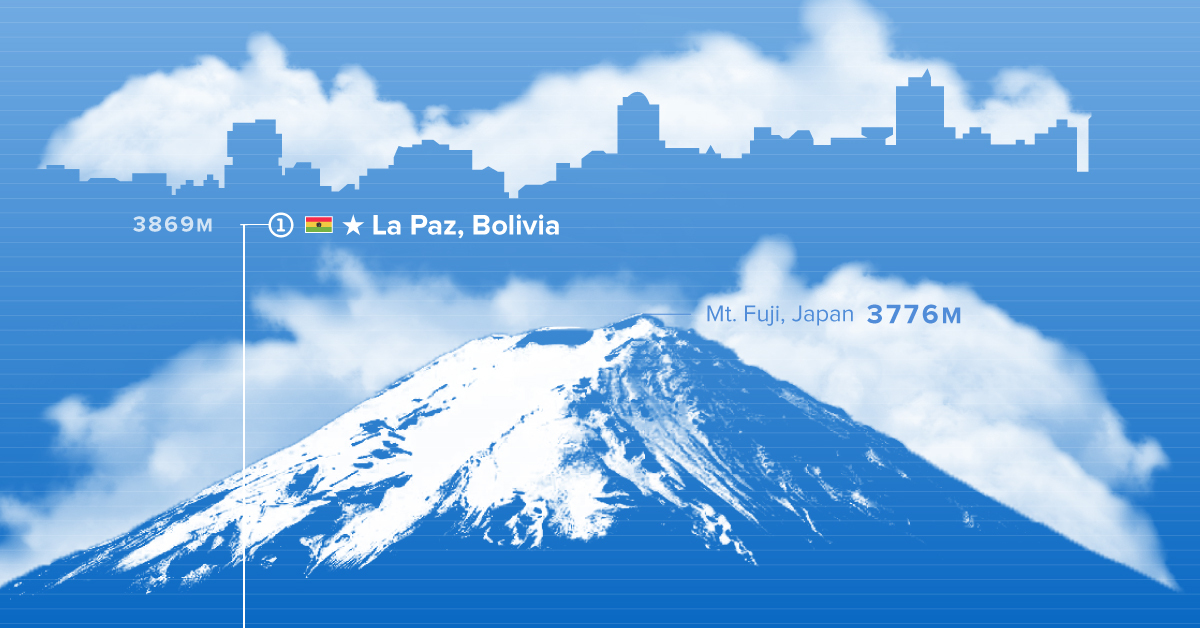
At the top of the pantheon is Bolivia’s El Alto-La Paz metropolitan area, which houses more than two million people at an average elevation of 3,869m above sea level. That’s a city of two million people situated more than 100 meters higher than Mount Fuji in Japan.
The next four are more than 1,000m lower than El Alto-La Paz, with Ecuador’s capital Quito coming in at second place at 2,784m and Colombia’s capital Bogotá rounding out the top five at 2,601m. For reference, that’s more than 100 meters higher than the world-famous Inca citadel Machu Picchu in Peru, which sits at a height of 2,430m.
It’s notable just how mountainous Latin America is. Of the 10 highest cities, three are in Mexico’s many mountainous regions and four of the top five are adjacent to the Andes Mountains.
Asia and the Americas Tower Above
Though it might be expected that countries would have their population centers close to sea level, many instead have followed in the footsteps of past civilizations by building in higher regions.
In addition to many capitals in South America, that list of major cities includes Mexico City, easily the largest on the list as the world’s 8th largest metropolis, Addis Ababa, the capital and largest city in Ethiopia, Tehran, the capital of Iran and most populous city in Western Asia, and Johannesburg, the largest city in South Africa.
The countries with the most high cities were China and Mexico, with eight each. China specifically had the most high metropolises in Asia, and many of the world’s highest settlements, though most of its major cities lie outside the Tibetan and Mongolian Plateaus.
| Regional Breakdown of Top 50 Highest Cities | |
|---|---|
| Central America | 10 |
| Eastern Asia | 9 |
| South-Central Asia | 9 |
| South America | 7 |
| Eastern Africa | 7 |
| Middle Africa | 2 |
| Southern Africa | 2 |
| Western Asia | 2 |
| Northern America | 2 |
| Europe | 0 |
| Oceania | 0 |
As the table above highlights, while wide mountainous regions are concentrated in much of Asia, Latin America, and Africa, the Western world is largely located close to the water.
The West Sits Below
The U.S. and Canada each only had one city each crack the top 50 list: the Rocky Mountain-adjacent cities of Denver and Calgary.
Meanwhile, despite the European Alps stretching across eight countries and both Australia and New Zealand having many mountains tall enough to crack the list, both Europe and Oceania had no major city situated more than 1,000m above sea level.
But though most of humanity remains concentrated near sea level, it is impressive to remember that hundreds of millions of people live in cities higher than Dubai’s Burj Khalifa, the world’s highest tower.
In fact, studies have shown that living at higher altitudes has associated health benefits, including better cardiovascular health and lower incidence of stroke and cancer.
Regardless if future trends push more people thousands of meters into the sky, humanity has proven that it can prosper.


Markets
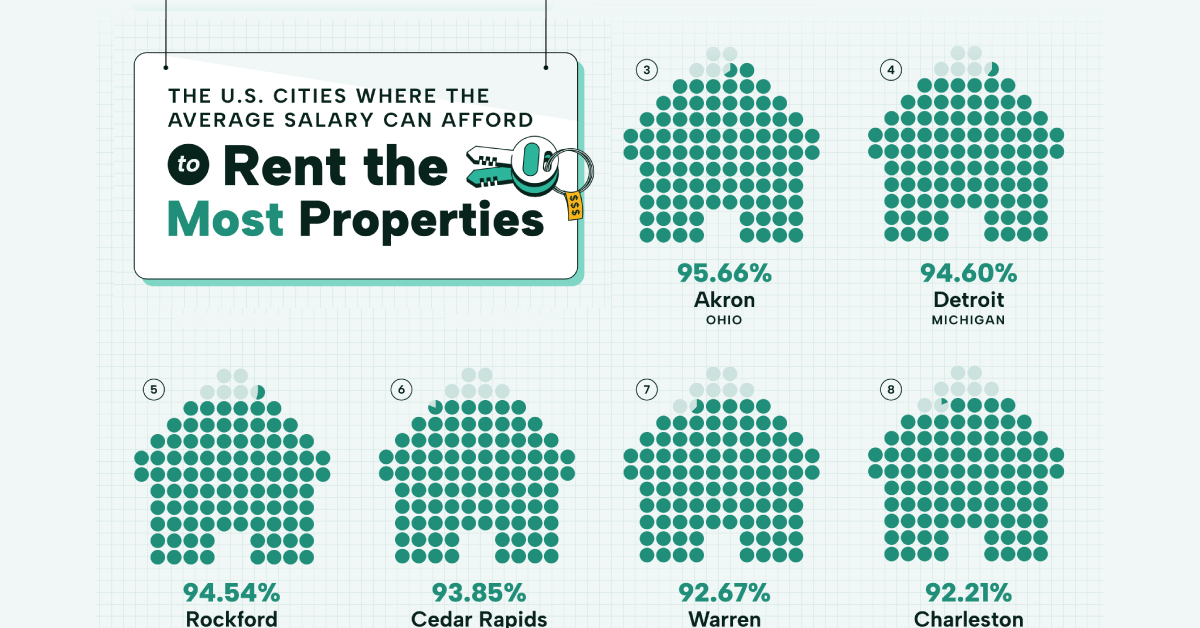
The Most Affordable U.S. Cities for Rent on an Average Salary
Visualizing the most affordable U.S. cities for renters by the percentage of affordable rentals available on an average salary.
 Creator Program
The Most Affordable U.S. Cities for Rent on an Average Salary
In 2023, 34% of the 131 million households in the U.S. lived in rented homes.
But which U.S. cities are the most affordable to rent in? The question isn’t just about cost, but about the average salary in each city, and some cities in expensive-seeming states turn out to be relatively affordable.
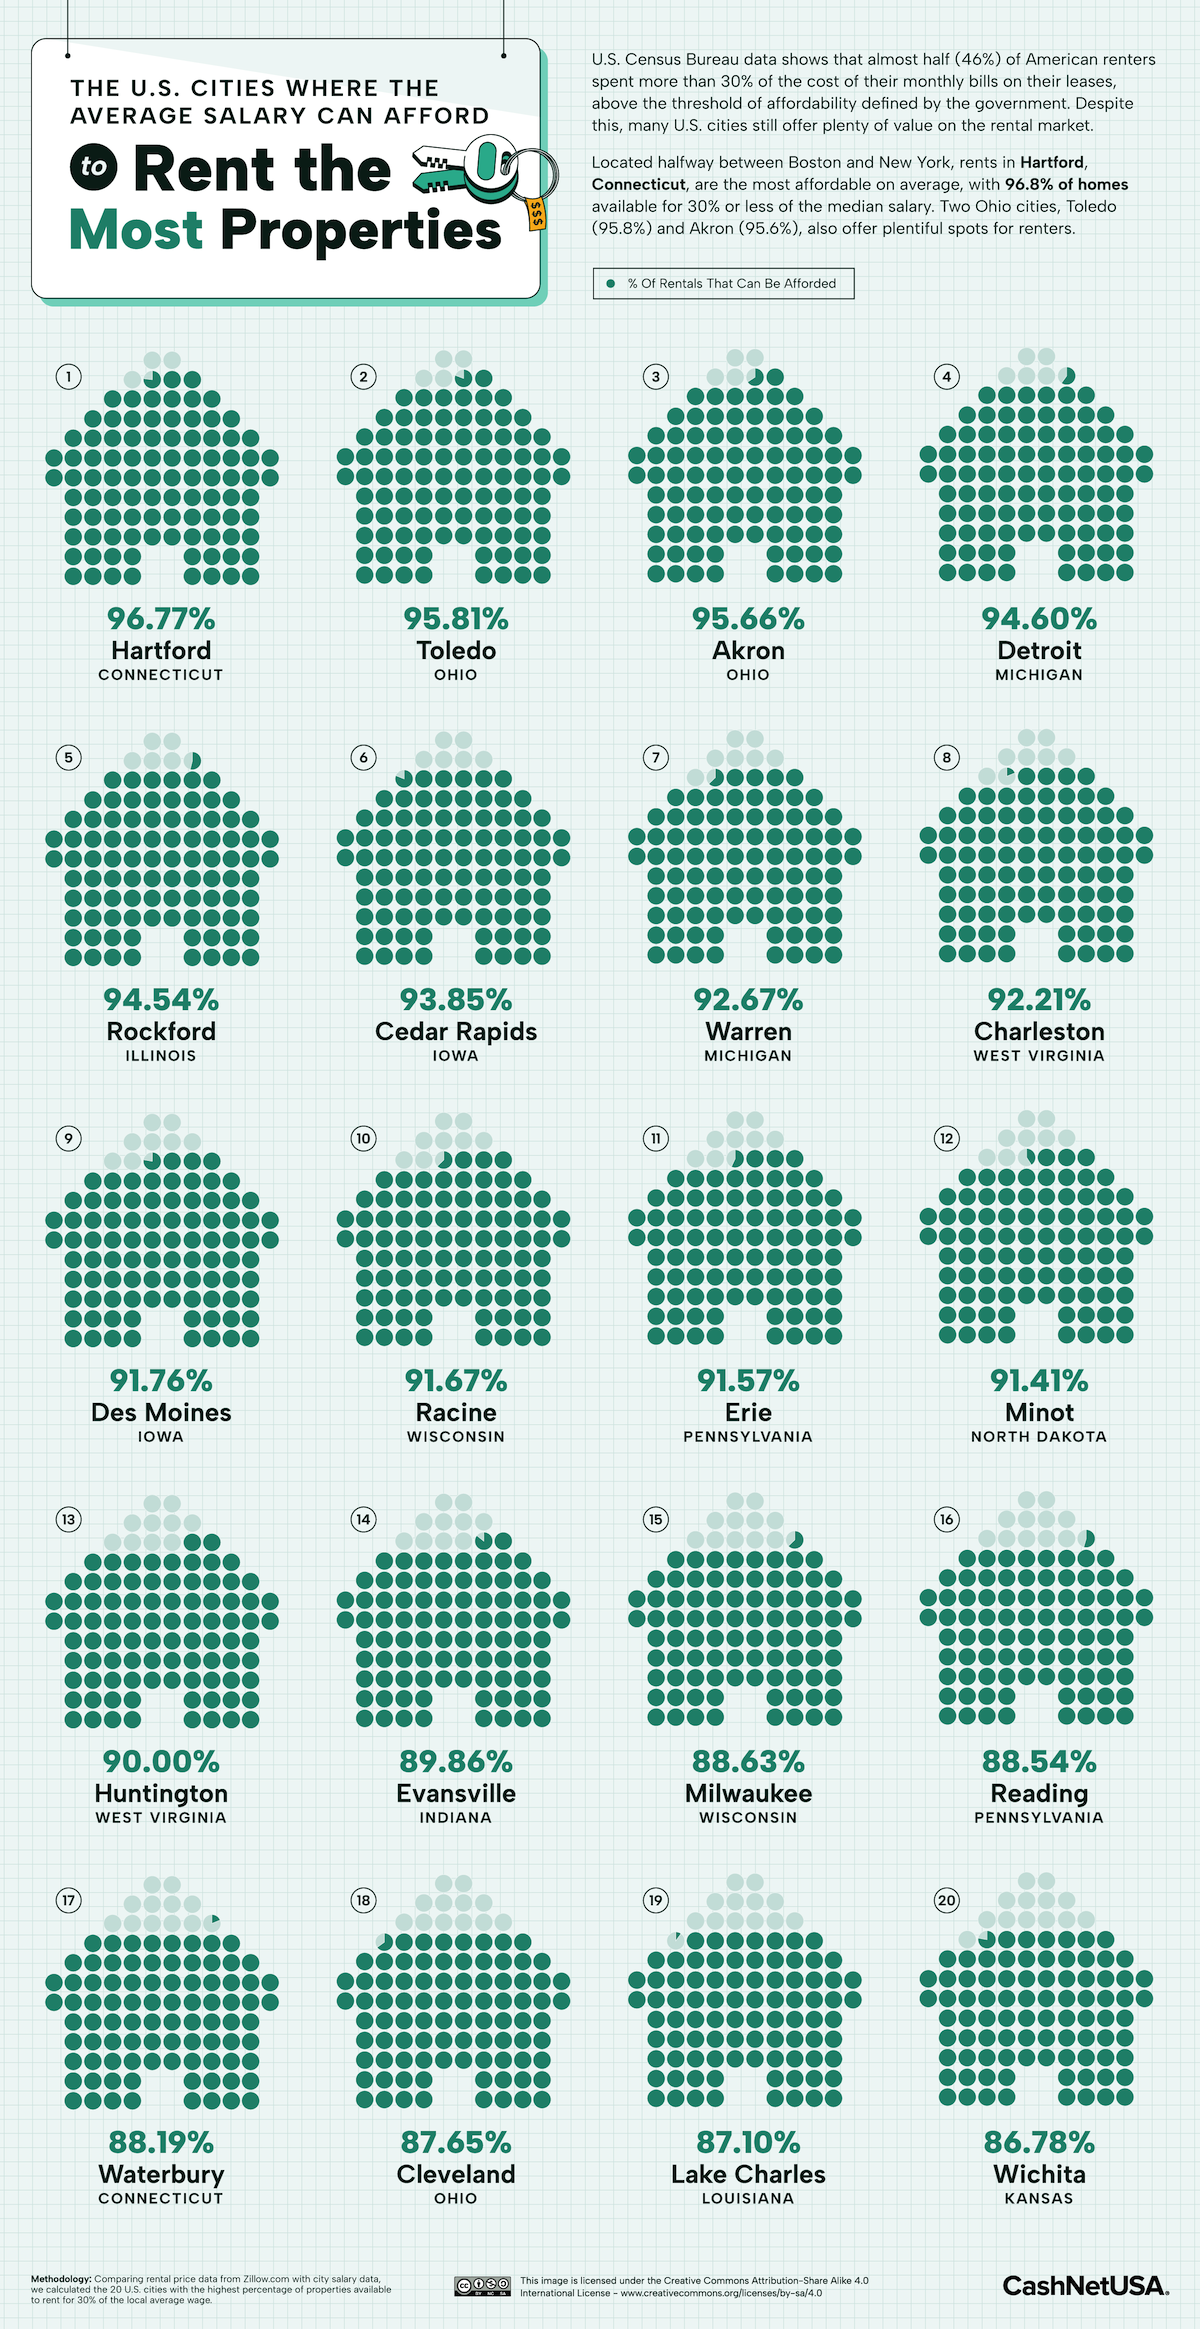
To answer the question, CashNetUSA found rental price data (as of August 2023) from Zillow.com and compared it to city salary data to calculate the percentage of properties available to rent for 30% or less of the local average income.
Ranked: Most Affordable American Cities for Renters
Ranked first, nearly 97% of the available rentals in Hartford can be rented for an affordable rate, based on average income.
This might be a surprising statistic. Connecticut was the richest U.S. state (by per capita income) for nearly three decades till 2019, and has one of the highest costs of living in the U.S.
However, it’s important to note that this data deals with averages instead of medians. For example, according to data from the Bureau of Labor Statistics, the average hourly wage for a Hartford resident—across all occupations—is slightly more than $33/hour, or close to $70,000 a year. Its median wage is almost $8/hour lower, which comes in at $53,000 a year.
Richer residents, with higher incomes might be skewing the apparent affordability of available rentals.
Note: Data current as of August, 2023.
Toledo and Akron, ranked second and third, have similar rates of affordability, with 95% of their available rentals falling within 30% of the city’s average wage. In fact Ohio has the most number of cities in the top 20, with Waterbury ranked 17th.
Detroit and Rockford round out the top five most affordable cities in the U.S. for renters. Both cities have affordable housing markets, after the Great Recession caused the local economies to tank, in turn causing an increase in crime and decline in population. Post-pandemic, however, both cities are on the rebound with an influx of industries, jobs, and people.
Where Does This Data Come From?
Source: CashNetUSA
Methodology: CashNetUSA sourced the average base salary of U.S. cities focusing on the 100 most populated cities in the country, plus the five most populated cities from each state. Using Zillow.com, they then counted how many rental properties per city were listed at a monthly price equivalent to 30% or less of a city’s monthly gross salary. The number of rental properties available per city was converted into a percentage score per city. Data for this research is accurate as of August 2023.

-

 Mining1 week ago
Gold vs. S&P 500: Which Has Grown More Over Five Years?
-

 Markets2 weeks ago
Ranked: The Most Valuable Housing Markets in America
-

 Money2 weeks ago
Which States Have the Highest Minimum Wage in America?
-

 AI2 weeks ago
Ranked: Semiconductor Companies by Industry Revenue Share
-

 Markets2 weeks ago
Ranked: The World’s Top Flight Routes, by Revenue
-

 Countries2 weeks ago
Population Projections: The World’s 6 Largest Countries in 2075
-

 Markets2 weeks ago
The Top 10 States by Real GDP Growth in 2023
-

 Demographics2 weeks ago
The Smallest Gender Wage Gaps in OECD Countries