

Just two countries account for half of the top 20 cities with the most billionaires. And the majority of the other half are found in Asia.
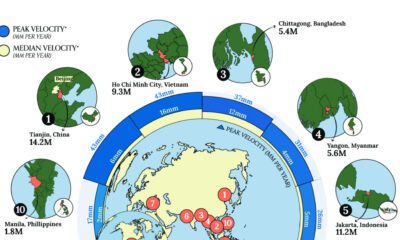

Many major coastal cities are experiencing local land subsidence where underground soil and rock collapse, causing the surface above to sink.


From someone born in the 19th century, in the midst of historic population growth, comes this vintage visualization showing world cities growing ever bigger.


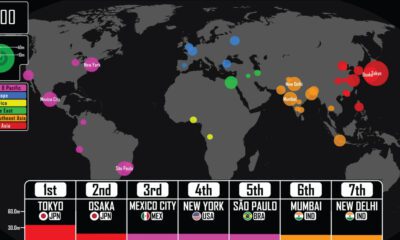
This graphic uses data taken from latest official censuses and projections to rank the largest cities by population.
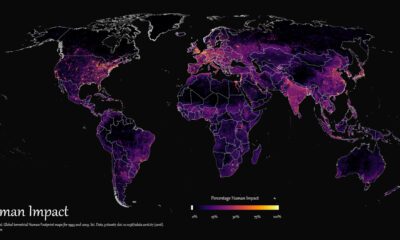

How far has humanity spread, and where haven't we gone? This graphic maps the extent of humanity’s impact on the world from 1993 to 2009.


This infographic highlights the 10 cities where international travelers spend the most. In 2022, Dubai took top spot.

Where were the largest cities in the world throughout history? This video details the rise (and fall) of the largest cities by population from 3,000 BCE.


From New York to Damascus, this infographic uses EIU cost of living data to rank the world's most and least expensive cities to live in
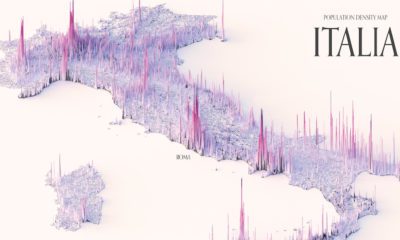

These maps show the population density of several countries, using 3D spikes to denote where more people live.
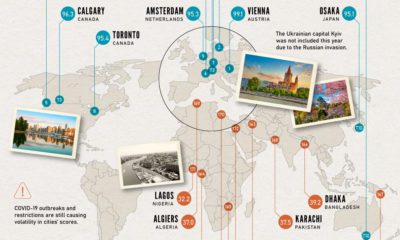

Which cities rank as the best places to live worldwide? This map reveals the world's most and least livable cities.


 Creator Program