population
Mapping Human Impact Across the World
Article/Editing:
Click to view this graphic in a higher-resolution.
Mapping Human Impact Across the World
Since the dawn of human history, our activities have left an impact on Earth—from gathering food to farming, from building homes and cities to traveling across oceans.
And as the global population expanded and civilizations became more complex, that impact grew alongside it. Mass agriculture, natural resource extraction, and creation of urban infrastructure are just some of the visible markers of modern human development.
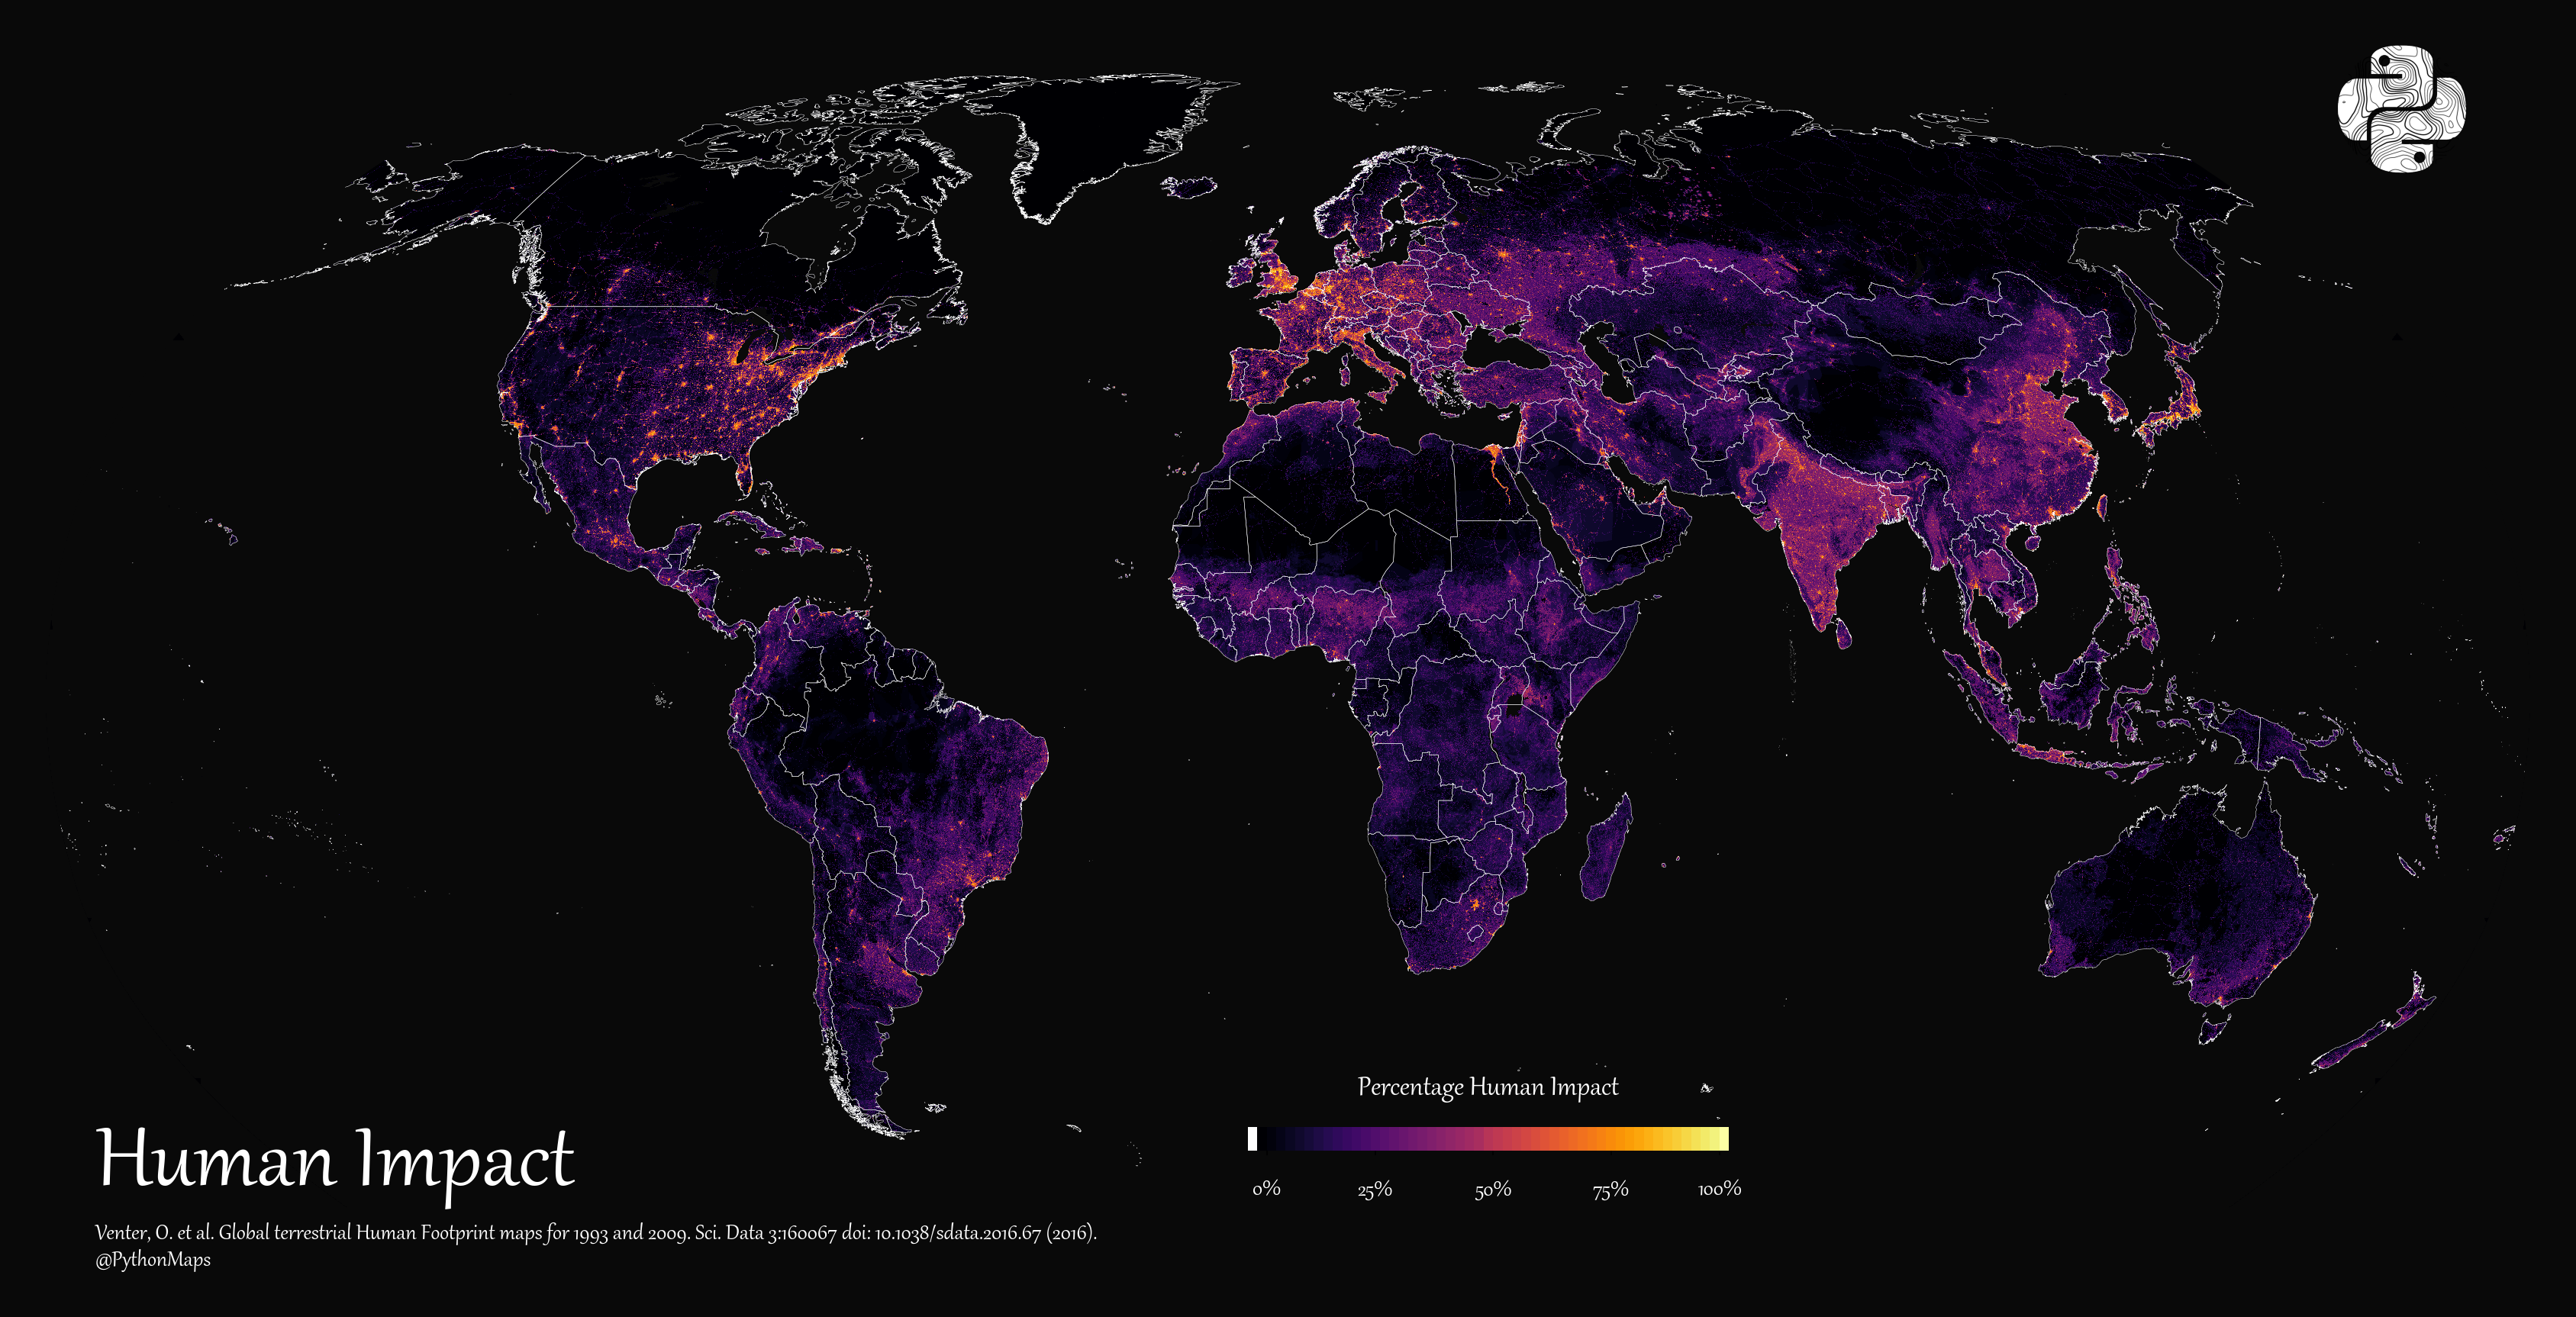
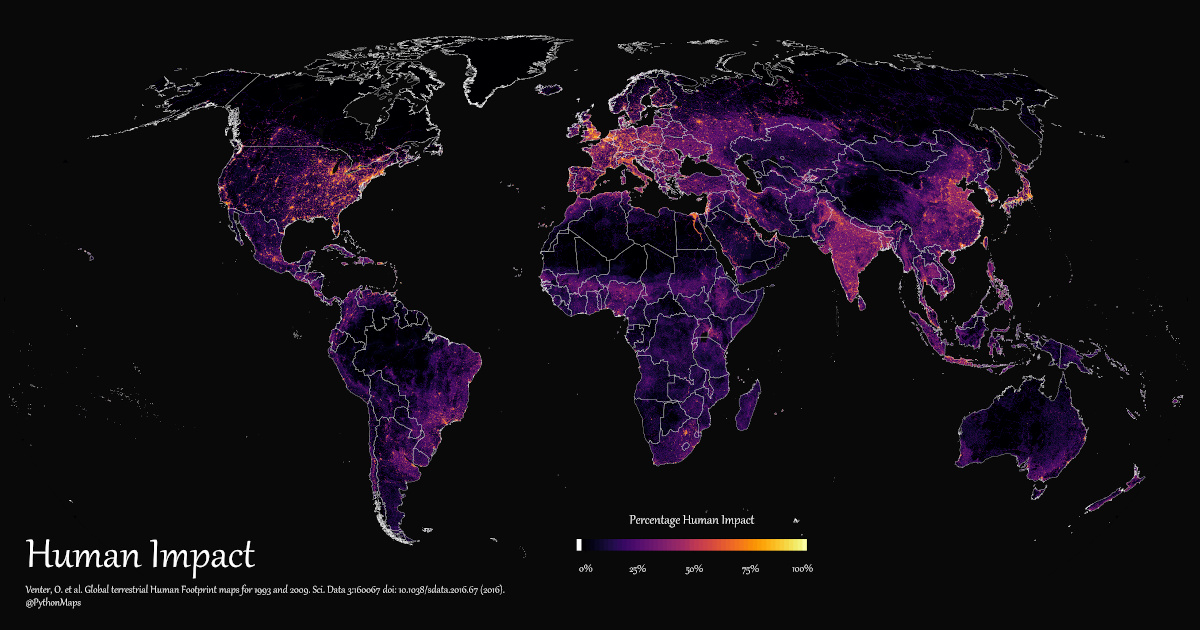
In this graphic, Adam Symington maps the extent of humanity’s impact on the world from 1993 to 2009, using information provided by the scientific paper titled “Global Terrestrial Human Footprint Maps for 1993 and 2009.”
Variables for Measuring Human Impact
To accurately plot and measure human impact, the researches compiled studies and surveys from 1993 to 2009 across eight variables of human “pressure”:
- Built environments
- Population density
- Night-time lights
- Croplands
- Pasture
- Roads
- Railways
- Navigable waterways
- The Boston–Washington corridor (including New York City) in the U.S.
- The “Blue Banana” corridor in Europe from the UK to Northern Italy.
- The Nile Delta and Greater Cairo in Egypt.
- The Taiheiyō Belt in Japan (including Tokyo and Osaka).
These different pressures were then normalized and weighted, as some have a noticeably greater impact on the surrounding environments than others. Once plotted and overlayed, we can see where human impact was the highest.
What Caused the Largest Impact?
According to the research, increases in population density, housing development, and road and rail networks were the primary growth factors for human impact.
This caused the overall footprint to increase dramatically in densest urban centers of the world. The brightest and most visible on the map include:
Many other areas in South America, Central Africa, and South Asia, also saw human impact increase due to both increased urbanization and agriculture. Especially noticeable is the relatively even growth in human impact across Pakistan, India, and Bangladesh.
Untouched Wildernesses
While humanity’s footprint has transformed various parts of the world, some areas have been left untouched, to some extent.
The frigid Arctic terrains of Northern Canada, Greenland, Iceland, and Eastern Russia barely saw any change between 1993 and 2009.
Likewise, the Amazon rainforest in South America, the Sahara Desert in Africa, the Tibetan Plateau in Asia and the desert in Western Australia had large swaths of land with almost no human impact. However, they all had small patches of measured human impact, either through infrastructure development or resource extraction.
And though there were still corners of the Earth with little to no human impact in 2009, changes since in demographics, politics, and consumption could have an outsized effect on humanity’s footprint both now and into the future.

This article was published as a part of Visual Capitalist's Creator Program, which features data-driven visuals from some of our favorite Creators around the world.


population
Mapped: North America Population Patterns by Density
Nearly half a billion people live on the third-largest continent. We take a closer look in this population map of North America.
Mapped: North America Population Patterns by Density
This was originally posted on our Voronoi app. Download the app for free on iOS or Android and discover incredible data-driven charts from a variety of trusted sources.
From the icy expanses of the Arctic to the warm Caribbean sea, the North American continent covers nearly 25 million square kilometers, or about 15% of the Earth’s land area. Populating this vast region are nearly half a billion people, spread out from coast to valley, along the edges of arid scrublands and rainforests.
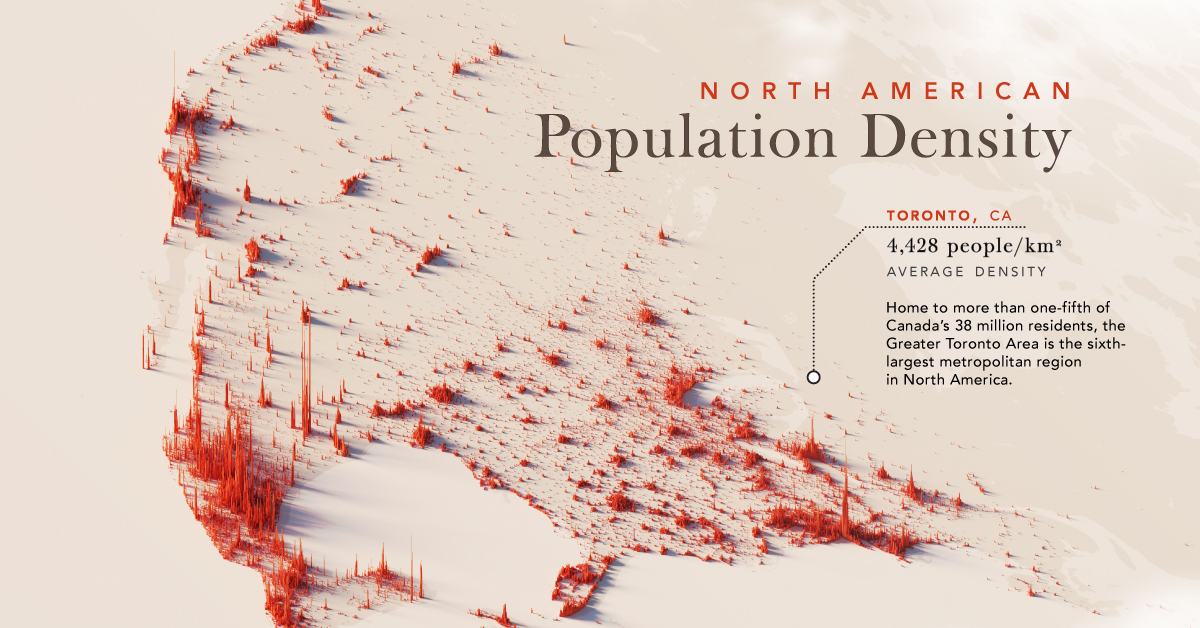
We visualize a map of North America population patterns, including Central America and the Caribbean, with spikes illustrating densely populated areas.
Data for this map is sourced from Statistics Canada, the World Bank, and WorldPop—a research group based out of the University of Southampton that tracks population growth and movement across the globe.
Ranked: Countries and Territories by Population Density
Deep in the Atlantic, seen as a small dot near Haiti on the map, the island state of Bermuda is the most densely populated jurisdiction on the continent. Measuring just 53 km² in area, and home to 65,000 people, results in an average population density of 1,266 people per km².
Also in the Caribbean, Barbados ranks second with an average population density 642 people/km², followed by Aruba, ranked third-highest at 550 people/km².
| Rank | Country/Territory | Average Population Density (per km²) | Area (km²) |
|---|---|---|---|
| 1 | 🇧🇲 Bermuda | 1,226 | 53 |
| 2 | 🇧🇧 Barbados | 642 | 439 |
| 3 | 🇦🇼 Aruba | 550 | 193 |
| 4 | 🇭🇹 Haiti | 423 | 27,750 |
| 5 | 🇵🇷 Puerto Rico | 360 | 8,897 |
| 6 | 🇲🇶 Martinique | 325 | 1,130 |
| 7 | 🇸🇻 El Salvador | 303 | 21,040 |
| 8 | 🇱🇨 Saint Lucia | 292 | 617 |
| 9 | 🇻🇮 Virgin Islands | 285 | 346 |
| 10 | 🇻🇨 Saint Vincent & the Grenadines | 267 | 389 |
| 11 | 🇯🇲 Jamaica | 257 | 10,992 |
| 12 | 🇬🇵 Guadeloupe | 252 | 1,628 |
| 13 | 🇩🇴 Dominican Republic | 234 | 48,442 |
| 14 | 🇧🇶 Netherlands Antilles | 229 | 800 |
| 15 | 🇹🇹 Trinidad & Tobago | 212 | 5,128 |
| 16 | 🇦🇬 Antigua & Barbuda | 214 | 440 |
| 17 | 🇻🇬 British Virgin Islands | 206 | 153 |
| 18 | 🇰🇳 Saint Kitts & Nevis | 176 | 269 |
| 19 | 🇦🇮 Anguilla | 175 | 91 |
| 20 | 🇰🇾 Cayman Islands | 168 | 264 |
| 21 | 🇬🇹 Guatemala | 165 | 108,889 |
| 22 | 🇨🇷 Costa Rica | 101 | 51,100 |
| 23 | 🇨🇺 Cuba | 102 | 109,884 |
| 24 | 🇭🇳 Honduras | 94 | 112,492 |
| 25 | 🇩🇲 Dominica | 91 | 750 |
| 26 | 🇲🇸 Montserrat | 91 | 103 |
| 27 | 🇹🇨 Turks & Caicos Islands | 75 | 616 |
| 28 | 🇲🇽 Mexico | 65 | 1,972,550 |
| 29 | 🇵🇦 Panama | 60 | 74,177 |
| 30 | 🇳🇮 Nicaragua | 54 | 130,370 |
| 31 | 🇺🇸 U.S. | 35 | 9,834,000 |
| 32 | 🇧🇸 The Bahamas | 29 | 13,880 |
| 33 | 🇵🇲 Saint-Pierre & Miquelon | 24 | 242 |
| 34 | 🇧🇿 Belize | 17 | 22,966 |
| 35 | 🇨🇦 Canada | 4 | 9,984,670 |
| 36 | 🇬🇱 Greenland | 0 | 2,166,086 |
| 37 | 🇺🇸 Navassa Island | 0 | 5 |
Naturally the largest countries on the continent—Canada, the U.S., and Mexico—have some of the lowest average population densities compared to other nations in the region.
However, thanks to their size, their overall population distribution is more apparent on a map of this scale. In Canada, the Greater Toronto Area is home to one-fifth the country’s entire population. In stark contrast, the rest of the country seems almost empty—averaging just 4 people/km².
Major U.S. cities—New York, Chicago, and San Francisco—also stand out, though the more regular dispersion of Americans, particularly in the Northeast, South, and Midwest can also be seen.
Interestingly, Monterrey in Mexico jumps out on the map; the city is built at the foot of Cerro de la Silla, and several districts are densely populated as a result.
Ranked: Continents by Population Density
How does North America compare to the other continents by population density?
Unsurprisingly, thanks to its large land area, as well as comparatively smaller population, North America is one of the least densely populated continents in the world, beaten only by Oceania, which averages 5 people/km², and Antarctica.
| Rank | Continent | Average Population Density (per/km²) |
|---|---|---|
| 1 | Asia | 149 |
| 2 | Africa | 49 |
| 3 | Europe | 32 |
| 4 | South America | 25 |
| 5 | North America | 25 |
| 6 | Oceania | 5 |
| 7 | Antarctica | 0 |
Source: World Population Review.
In comparison, Asia, while being the largest continent, is also home to 60% of the global population, and averages 149 people/km².

-

 Science1 week ago
Visualizing the Average Lifespans of Mammals
-

 Demographics2 weeks ago
The Smallest Gender Wage Gaps in OECD Countries
-

 United States2 weeks ago
Where U.S. Inflation Hit the Hardest in March 2024
-

 Green2 weeks ago
Top Countries By Forest Growth Since 2001
-

 United States2 weeks ago
Ranked: The Largest U.S. Corporations by Number of Employees
-

 Maps2 weeks ago
The Largest Earthquakes in the New York Area (1970-2024)
-

 Green2 weeks ago
Ranked: The Countries With the Most Air Pollution in 2023
-

 Green2 weeks ago
Ranking the Top 15 Countries by Carbon Tax Revenue