Healthcare
Charted: Average Years Left to Live by Age
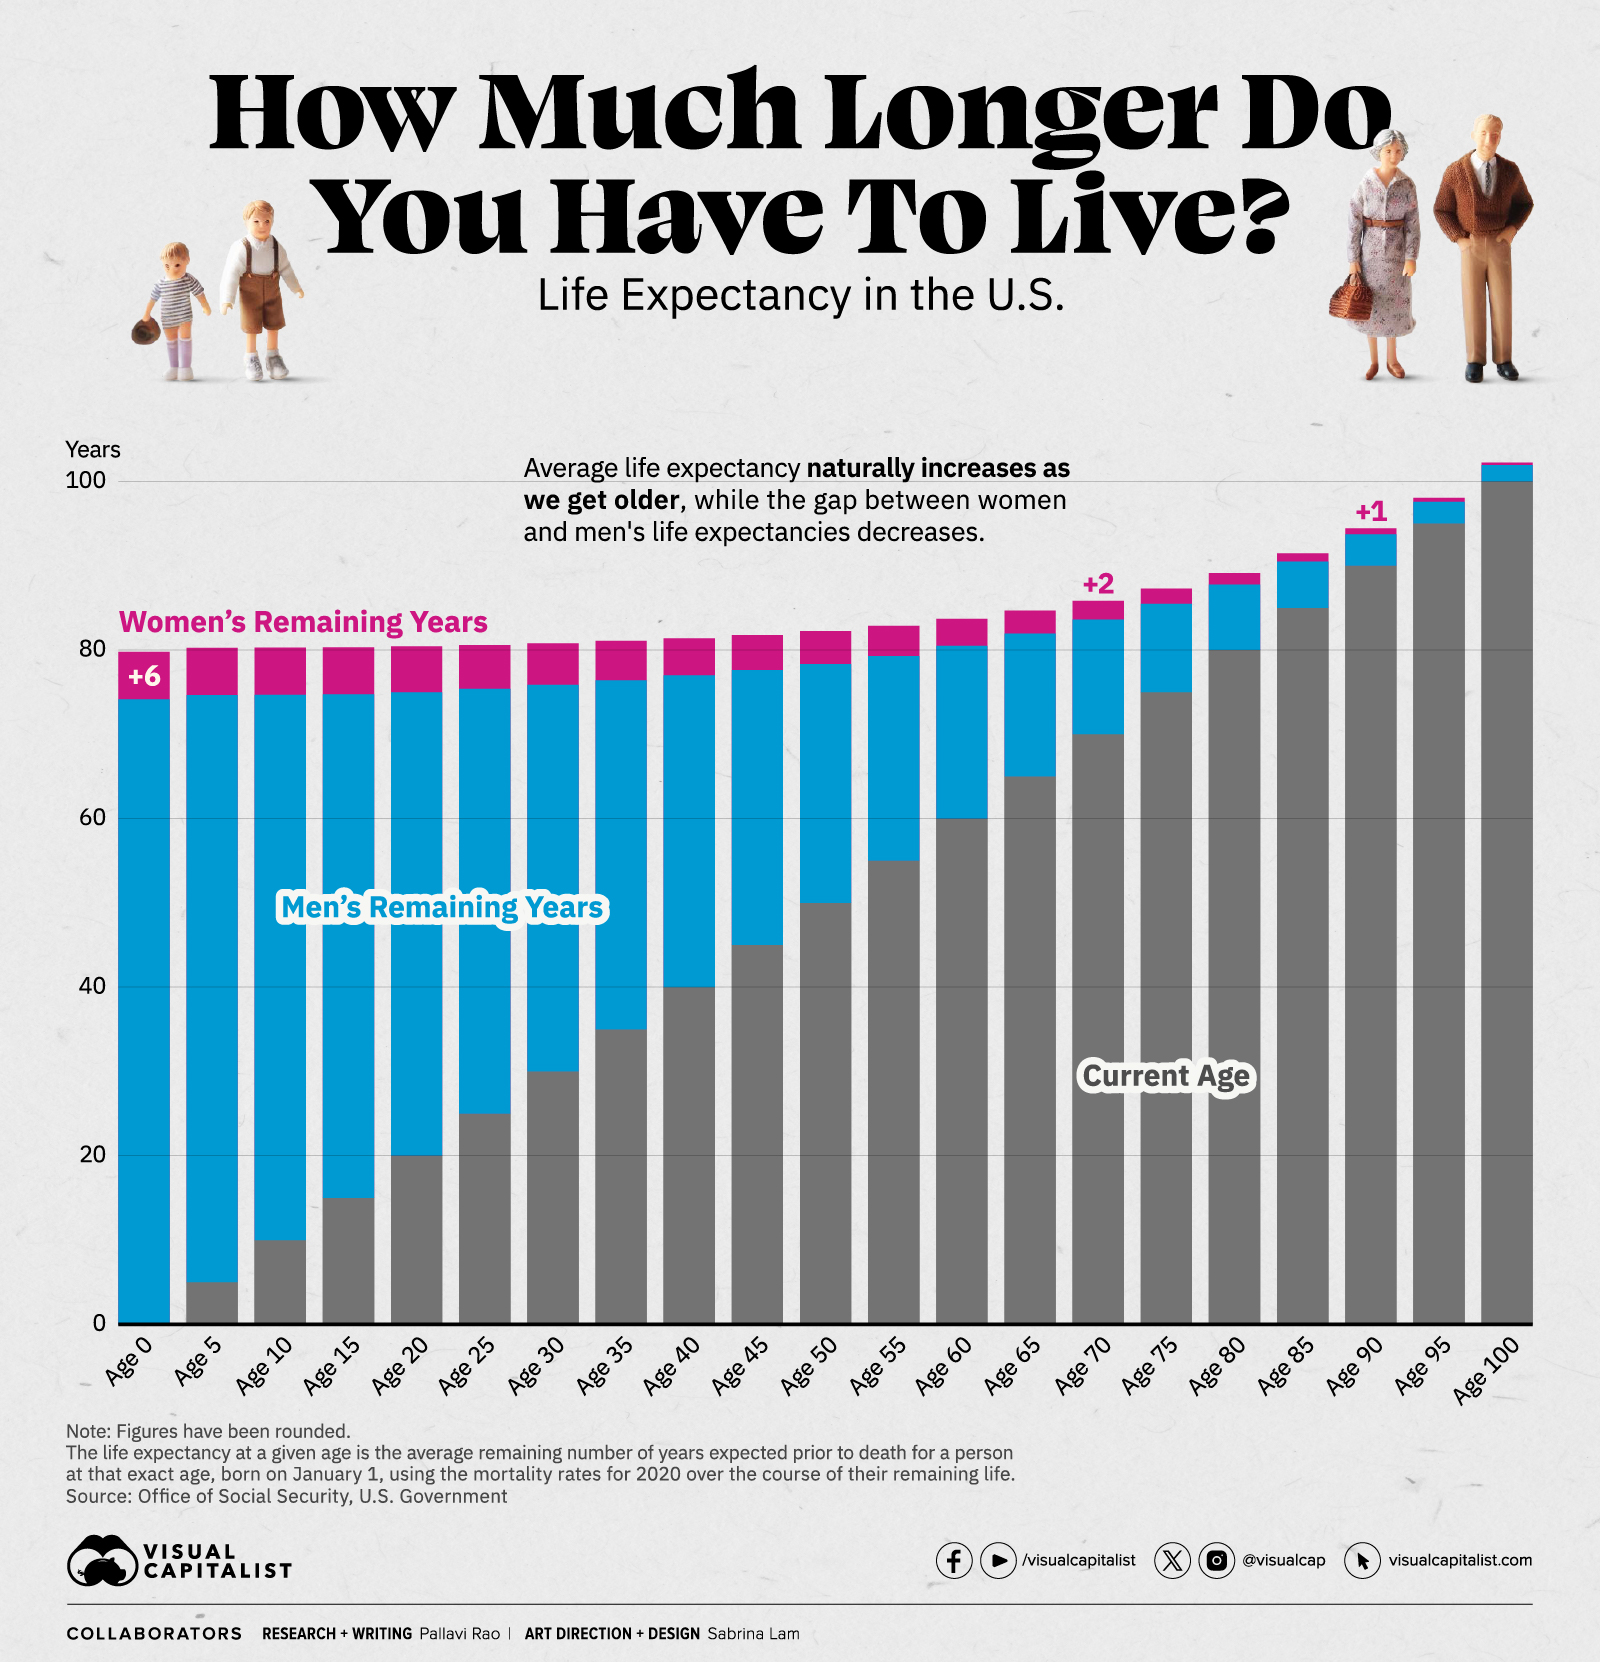
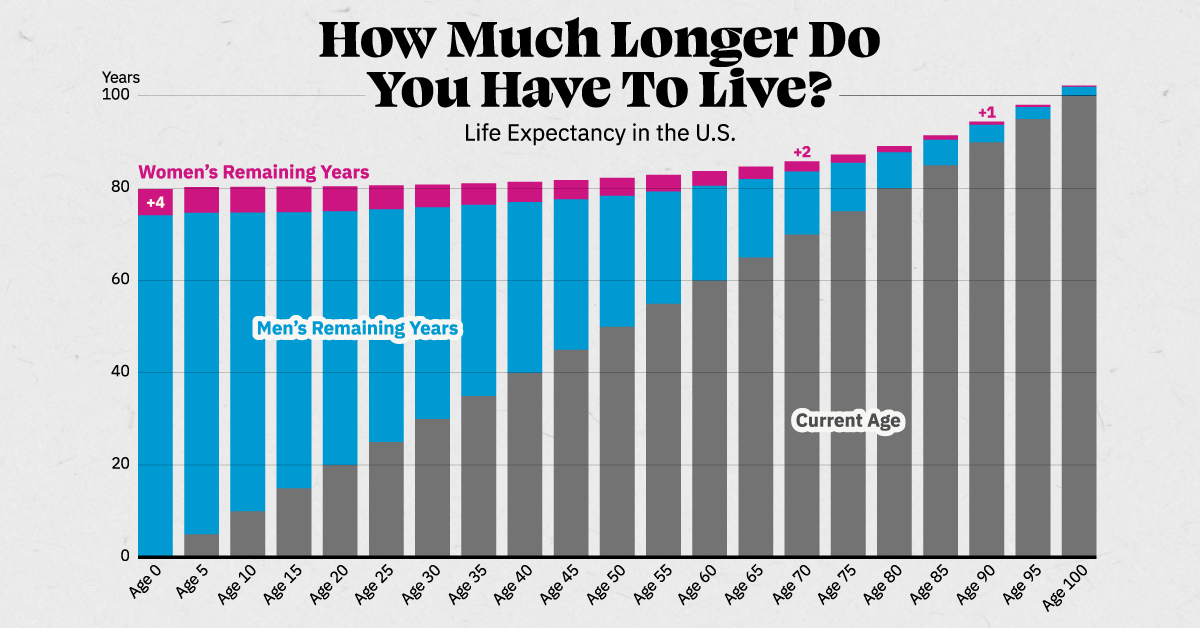
How Many Years Do You Have Left to Live?
At the start of the 19th century, when there fewer than 1 billion humans on the earth, global life expectancy at birth stood at roughly 29 years.
This is a startlingly low figure—because life expectancy is a statistical projection of how many more years a person can expect to live, based on the mortality rates at the time. And since the infant mortality rate in particular was so high, life expectancies accurately summarized the low likelihood of many babies living to adulthood.
However, since the 1920s, life expectancy across all ages has improved leaps and bounds, thanks to rapid advancements in nutrition, healthcare, and sanitation.
We visualized the current American life expectancy by age and gender, using data from the Office of Social Security, which bases their current projections on 2020 mortality rates.
American Life Expectancy at Every Age
A key takeaway with life expectancy is that it increases as one gets older. This is easily seen in the table below, which lists the remaining years left to live at a given age for an American male and the projected life expectancy.
| Age | Years Remaining (Men) | Life Expectancy (Men) |
|---|---|---|
| 0 | 74.12 | 74.12 |
| 1 | 73.55 | 74.55 |
| 2 | 72.58 | 74.58 |
| 3 | 71.60 | 74.60 |
| 4 | 70.62 | 74.62 |
| 5 | 69.63 | 74.63 |
| 6 | 68.64 | 74.64 |
| 7 | 67.65 | 74.65 |
| 8 | 66.65 | 74.65 |
| 9 | 65.66 | 74.66 |
| 10 | 64.67 | 74.67 |
| 11 | 63.68 | 74.68 |
| 12 | 62.69 | 74.69 |
| 13 | 61.70 | 74.70 |
| 14 | 60.71 | 74.71 |
| 15 | 59.73 | 74.73 |
| 16 | 58.76 | 74.76 |
| 17 | 57.79 | 74.79 |
| 18 | 56.84 | 74.84 |
| 19 | 55.90 | 74.90 |
| 20 | 54.97 | 74.97 |
| 21 | 54.04 | 75.04 |
| 22 | 53.12 | 75.12 |
| 23 | 52.21 | 75.21 |
| 24 | 51.30 | 75.30 |
| 25 | 50.39 | 75.39 |
| 26 | 49.48 | 75.48 |
| 27 | 48.57 | 75.57 |
| 28 | 47.66 | 75.66 |
| 29 | 46.76 | 75.76 |
| 30 | 45.86 | 75.86 |
| 31 | 44.97 | 75.97 |
| 32 | 44.07 | 76.07 |
| 33 | 43.18 | 76.18 |
| 34 | 42.29 | 76.29 |
| 35 | 41.39 | 76.39 |
| 36 | 40.50 | 76.50 |
| 37 | 39.62 | 76.62 |
| 38 | 38.73 | 76.73 |
| 39 | 37.85 | 76.85 |
| 40 | 36.97 | 76.97 |
| 41 | 36.09 | 77.09 |
| 42 | 35.21 | 77.21 |
| 43 | 34.34 | 77.34 |
| 44 | 33.46 | 77.46 |
| 45 | 32.59 | 77.59 |
| 46 | 31.73 | 77.73 |
| 47 | 30.87 | 77.87 |
| 48 | 30.01 | 78.01 |
| 49 | 29.17 | 78.17 |
| 50 | 28.33 | 78.33 |
| 51 | 27.50 | 78.50 |
| 52 | 26.67 | 78.67 |
| 53 | 25.86 | 78.86 |
| 54 | 25.06 | 79.06 |
| 55 | 24.27 | 79.27 |
| 56 | 23.48 | 79.48 |
| 57 | 22.71 | 79.71 |
| 58 | 21.95 | 79.95 |
| 59 | 21.21 | 80.21 |
| 60 | 20.47 | 80.47 |
| 61 | 19.74 | 80.74 |
| 62 | 19.03 | 81.03 |
| 63 | 18.32 | 81.32 |
| 64 | 17.63 | 81.63 |
| 65 | 16.94 | 81.94 |
| 66 | 16.26 | 82.26 |
| 67 | 15.58 | 82.58 |
| 68 | 14.91 | 82.91 |
| 69 | 14.24 | 83.24 |
| 70 | 13.59 | 83.59 |
| 71 | 12.94 | 83.94 |
| 72 | 12.30 | 84.30 |
| 73 | 11.67 | 84.67 |
| 74 | 11.05 | 85.05 |
| 75 | 10.46 | 85.46 |
| 76 | 9.88 | 85.88 |
| 77 | 9.32 | 86.32 |
| 78 | 8.77 | 86.77 |
| 79 | 8.25 | 87.25 |
| 80 | 7.74 | 87.74 |
| 81 | 7.25 | 88.25 |
| 82 | 6.77 | 88.77 |
| 83 | 6.31 | 89.31 |
| 84 | 5.88 | 89.88 |
| 85 | 5.47 | 90.47 |
| 86 | 5.07 | 91.07 |
| 87 | 4.70 | 91.70 |
| 88 | 4.35 | 92.35 |
| 89 | 4.02 | 93.02 |
| 90 | 3.72 | 93.72 |
| 91 | 3.44 | 94.44 |
| 92 | 3.18 | 95.18 |
| 93 | 2.96 | 95.96 |
| 94 | 2.75 | 96.75 |
| 95 | 2.57 | 97.57 |
| 96 | 2.42 | 98.42 |
| 97 | 2.28 | 99.28 |
| 98 | 2.15 | 100.15 |
| 99 | 2.04 | 101.04 |
| 100 | 1.93 | 101.93 |
| 101 | 1.83 | 102.83 |
| 102 | 1.73 | 103.73 |
| 103 | 1.63 | 104.63 |
| 104 | 1.54 | 105.54 |
| 105 | 1.45 | 106.45 |
| 106 | 1.36 | 107.36 |
| 107 | 1.27 | 108.27 |
| 108 | 1.18 | 109.18 |
| 109 | 1.10 | 110.10 |
| 110 | 1.02 | 111.02 |
| 111 | 0.95 | 111.95 |
| 112 | 0.88 | 112.88 |
| 113 | 0.82 | 113.82 |
| 114 | 0.76 | 114.76 |
| 115 | 0.70 | 115.70 |
| 116 | 0.65 | 116.65 |
| 117 | 0.60 | 117.60 |
| 118 | 0.56 | 118.56 |
| 119 | 0.52 | 119.52 |
| 120 | 0.48 | 120.48 |
At birth, an average American baby boy can expect to live till just past 74. But if the boy reaches adulthood, then at 21 he might live to a full year more, past 75. This trend persists even towards the end of life when the years we have left drop rapidly, influenced by the higher likelihood of death.
American women, on the other hand, have a higher life expectancy than men. At birth the gap is close to six years, narrowing steadily to around one year by 85.
| Age | Years Remaining (Women) | Life Expectancy (Women) |
|---|---|---|
| 0 | 79.78 | 79.78 |
| 1 | 79.17 | 80.17 |
| 2 | 78.19 | 80.19 |
| 3 | 77.21 | 80.21 |
| 4 | 76.22 | 80.22 |
| 5 | 75.23 | 80.23 |
| 6 | 74.24 | 80.24 |
| 7 | 73.25 | 80.25 |
| 8 | 72.25 | 80.25 |
| 9 | 71.26 | 80.26 |
| 10 | 70.27 | 80.27 |
| 11 | 69.27 | 80.27 |
| 12 | 68.28 | 80.28 |
| 13 | 67.29 | 80.29 |
| 14 | 66.30 | 80.30 |
| 15 | 65.31 | 80.31 |
| 16 | 64.32 | 80.32 |
| 17 | 63.34 | 80.34 |
| 18 | 62.36 | 80.36 |
| 19 | 61.38 | 80.38 |
| 20 | 60.41 | 80.41 |
| 21 | 59.44 | 80.44 |
| 22 | 58.47 | 80.47 |
| 23 | 57.50 | 80.50 |
| 24 | 56.54 | 80.54 |
| 25 | 55.58 | 80.58 |
| 26 | 54.61 | 80.61 |
| 27 | 53.66 | 80.66 |
| 28 | 52.70 | 80.70 |
| 29 | 51.74 | 80.74 |
| 30 | 50.79 | 80.79 |
| 31 | 49.84 | 80.84 |
| 32 | 48.89 | 80.89 |
| 33 | 47.94 | 80.94 |
| 34 | 47.00 | 81.00 |
| 35 | 46.06 | 81.06 |
| 36 | 45.12 | 81.12 |
| 37 | 44.18 | 81.18 |
| 38 | 43.24 | 81.24 |
| 39 | 42.31 | 81.31 |
| 40 | 41.38 | 81.38 |
| 41 | 40.45 | 81.45 |
| 42 | 39.52 | 81.52 |
| 43 | 38.60 | 81.60 |
| 44 | 37.68 | 81.68 |
| 45 | 36.76 | 81.76 |
| 46 | 35.85 | 81.85 |
| 47 | 34.94 | 81.94 |
| 48 | 34.04 | 82.04 |
| 49 | 33.14 | 82.14 |
| 50 | 32.24 | 82.24 |
| 51 | 31.35 | 82.35 |
| 52 | 30.47 | 82.47 |
| 53 | 29.59 | 82.59 |
| 54 | 28.72 | 82.72 |
| 55 | 27.86 | 82.86 |
| 56 | 27.01 | 83.01 |
| 57 | 26.16 | 83.16 |
| 58 | 25.32 | 83.32 |
| 59 | 24.49 | 83.49 |
| 60 | 23.67 | 83.67 |
| 61 | 22.85 | 83.85 |
| 62 | 22.04 | 84.04 |
| 63 | 21.24 | 84.24 |
| 64 | 20.45 | 84.45 |
| 65 | 19.66 | 84.66 |
| 66 | 18.88 | 84.88 |
| 67 | 18.10 | 85.10 |
| 68 | 17.34 | 85.34 |
| 69 | 16.58 | 85.58 |
| 70 | 15.82 | 85.82 |
| 71 | 15.08 | 86.08 |
| 72 | 14.36 | 86.36 |
| 73 | 13.64 | 86.64 |
| 74 | 12.94 | 86.94 |
| 75 | 12.26 | 87.26 |
| 76 | 11.60 | 87.60 |
| 77 | 10.95 | 87.95 |
| 78 | 10.31 | 88.31 |
| 79 | 9.70 | 88.70 |
| 80 | 9.10 | 89.10 |
| 81 | 8.53 | 89.53 |
| 82 | 7.98 | 89.98 |
| 83 | 7.44 | 90.44 |
| 84 | 6.93 | 90.93 |
| 85 | 6.44 | 91.44 |
| 86 | 5.99 | 91.99 |
| 87 | 5.55 | 92.55 |
| 88 | 5.15 | 93.15 |
| 89 | 4.76 | 93.76 |
| 90 | 4.41 | 94.41 |
| 91 | 4.08 | 95.08 |
| 92 | 3.78 | 95.78 |
| 93 | 3.51 | 96.51 |
| 94 | 3.27 | 97.27 |
| 95 | 3.05 | 98.05 |
| 96 | 2.85 | 98.85 |
| 97 | 2.68 | 99.68 |
| 98 | 2.52 | 100.52 |
| 99 | 2.37 | 101.37 |
| 100 | 2.23 | 102.23 |
| 101 | 2.09 | 103.09 |
| 102 | 1.96 | 103.96 |
| 103 | 1.84 | 104.84 |
| 104 | 1.72 | 105.72 |
| 105 | 1.61 | 106.61 |
| 106 | 1.51 | 107.51 |
| 107 | 1.41 | 108.41 |
| 108 | 1.32 | 109.32 |
| 109 | 1.24 | 110.24 |
| 110 | 1.16 | 111.16 |
| 111 | 1.09 | 112.09 |
| 112 | 1.02 | 113.02 |
| 113 | 0.96 | 113.96 |
| 114 | 0.90 | 114.90 |
| 115 | 0.85 | 115.85 |
| 116 | 0.80 | 116.80 |
| 117 | 0.75 | 117.75 |
| 118 | 0.70 | 118.70 |
| 119 | 0.66 | 119.66 |
| 120 | 0.62 | 120.62 |
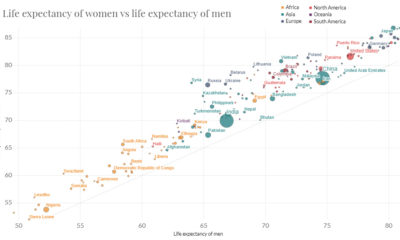
Interestingly, women outlive men in nearly every country in the world, due to a mix of sociological, behavioral, and biological reasons.
COVID-19: Reversing A Decade of Increasing American Life Expectancy
While the current American life expectancy at birth seems reasonably high, it is nearly two years lower than the 2022 figure which used the 2019 mortality rate. It is also lower than the life expectancy at birth in 2009, which used 2005 mortality rate.
| Year | Life Expectancy at Birth (Men) | Life Expectancy at Birth (Women) |
|---|---|---|
| 2009 | 74.12 | 79.95 |
| 2014 | 76.10 | 80.94 |
| 2019 | 76.04 | 80.99 |
| 2023 | 74.12 | 79.78 |
American mortality rates went up 17% between 2019–2020, in part because of COVID-19, in turn affecting life expectancy. The U.S. also had a higher COVID-19 mortality rate compared to its peers two years after the pandemic first struck.
Thus, American life expectancy may not improve immediately to 2019 levels, which can affect insurance premiums, pension benefits, and plans.
Where Does This Data Come From?
Source: Office of Social Security, U.S. Government.
Note: The life expectancy at a given age is the average remaining number of years expected prior to death for a person at that exact age, born on January 1, using the mortality rates for 2020 over the course of their remaining life.


Healthcare
The Cost of an EpiPen in Major Markets
This visualization compares EpiPen prices around the world, with the U.S. having the highest prices by far.


The Cost of an EpiPen in Major Markets
This was originally posted on our Voronoi app. Download the app for free on iOS or Android and discover incredible data-driven charts from a variety of trusted sources.
EpiPens are auto-injectors containing epinephrine, a drug that can treat or reverse severe allergic reactions, potentially preventing death.
The global epinephrine market was valued at $1.75 billion in 2022 and is projected to reach $4.08 billion by 2030. North America represents over 60% of the market.
EpiPens, however, can be prohibitively expensive in some regions.
In this graphic, we present estimated EpiPen prices in major global markets, compiled by World Population Review and converted to U.S. dollars as of August 2023.
Why are U.S. Prices so High?
The U.S. stands out as the most expensive market for EpiPens, despite over 1 million Americans having epinephrine prescriptions. After Mylan (now part of Pfizer) acquired the rights to produce EpiPens in the U.S. in 2007, the cost of a two-pack skyrocketed to $600, up from about $60.
| Country | Price (USD) |
|---|---|
| 🇺🇸 U.S. | 300* |
| 🇯🇵 Japan | 98 |
| 🇩🇪 Germany | 85 |
| 🇨🇦 Canada | 80 |
| 🇫🇷 France | 76 |
| 🇦🇺 Australia | 66 |
| 🇬🇧 UK | 61 |
| 🇮🇳 India | 30 |
*Per unit cost. Commonly sold as a two-pack, meaning total cost is equal to $600
Former Mylan CEO Heather Bresch defended the price hikes to Congress, citing minimal profit margins. Mylan eventually settled with the U.S. government for a nine-figure sum.
Notably, EpiPens are available at a fraction of the cost in other developed countries like Japan, Germany, and Canada.
Making EpiPens More Affordable
Efforts to improve EpiPen affordability are underway in several U.S. states. For instance, the Colorado House approved a $60 price cap on epinephrine, now under review by the state Senate.
Similar measures in Rhode Island, Delaware, Missouri, and Vermont aim to ensure insurance coverage for epinephrine, which is not currently mandatory, although most health plans cover it.

-

 Education1 week ago
How Hard Is It to Get Into an Ivy League School?
-

 Technology2 weeks ago
Ranked: Semiconductor Companies by Industry Revenue Share
-

 Markets2 weeks ago
Ranked: The World’s Top Flight Routes, by Revenue
-

 Demographics2 weeks ago
Population Projections: The World’s 6 Largest Countries in 2075
-

 Markets2 weeks ago
The Top 10 States by Real GDP Growth in 2023
-

 Demographics2 weeks ago
The Smallest Gender Wage Gaps in OECD Countries
-

 Economy2 weeks ago
Where U.S. Inflation Hit the Hardest in March 2024
-

 Environment2 weeks ago
Top Countries By Forest Growth Since 2001