Markets
Visualizing U.S. GDP by Industry in 2023
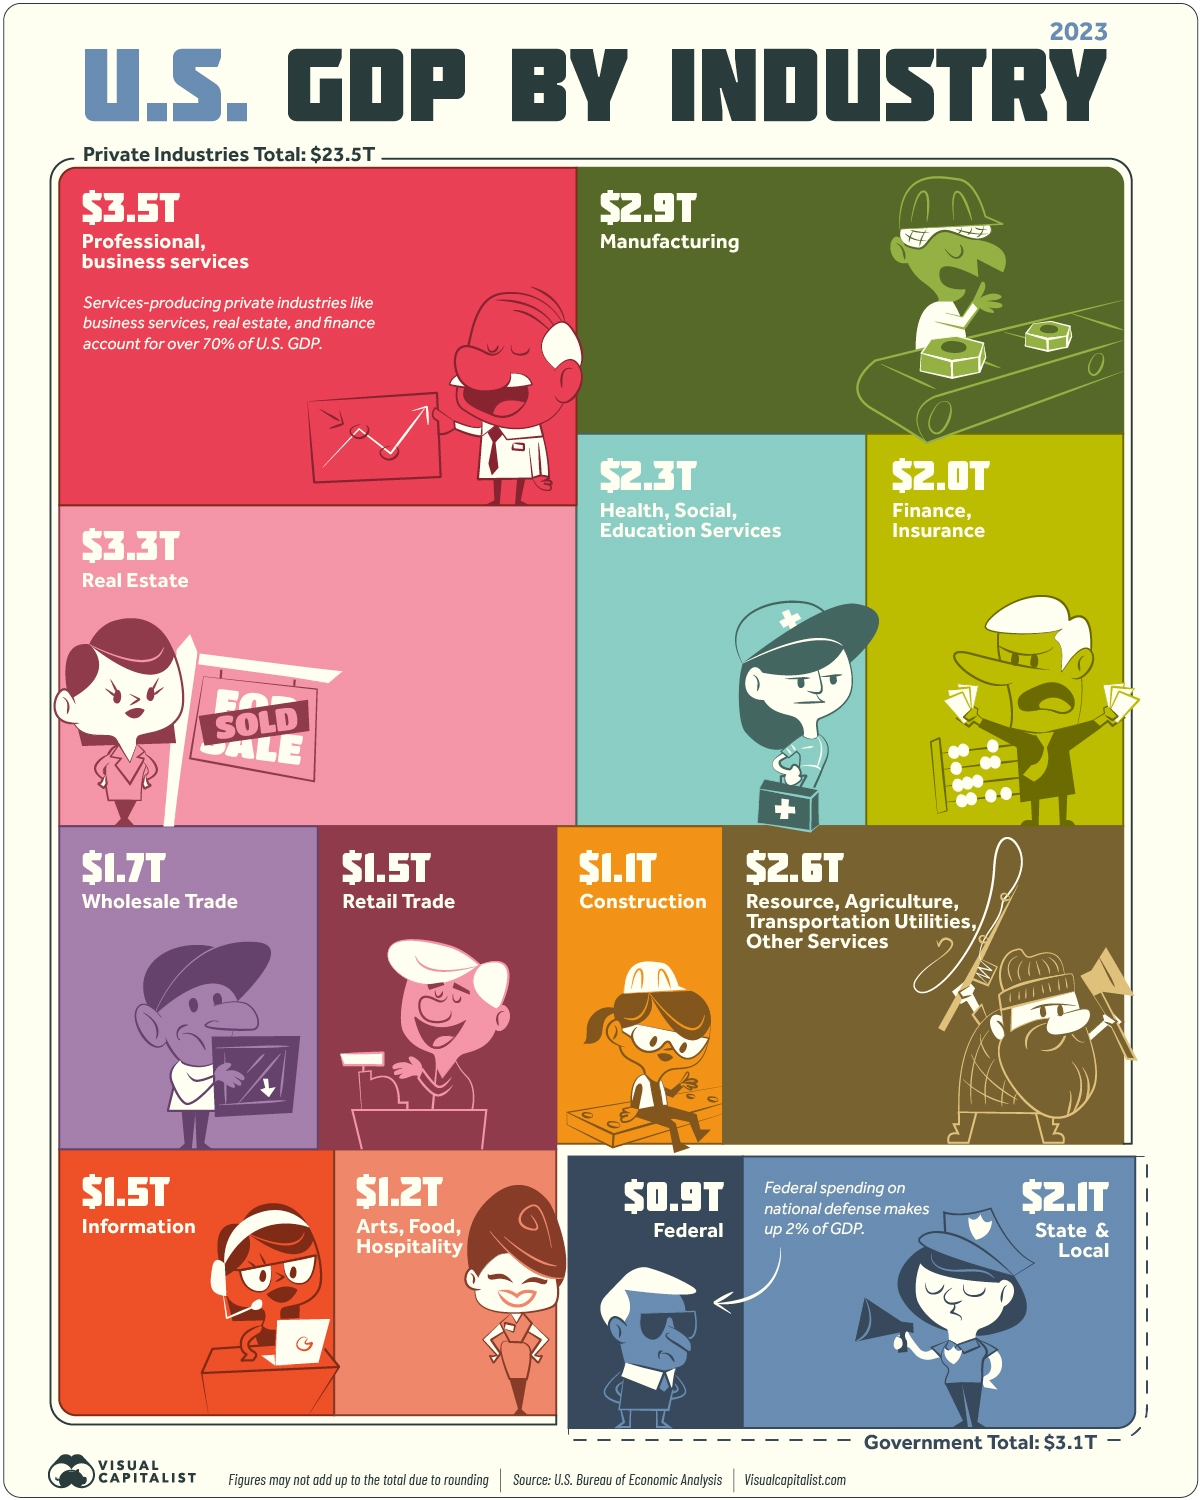
Visualizing U.S. GDP by Industry
The U.S. economy is like a giant machine driven by many different industries, each one akin to an essential cog that moves the whole.
Understanding the breakdown of national gross domestic product (GDP) by industry shows where commercial activity is bustling and how diverse the economy truly is.
The above infographic uses data from the Bureau of Economic Analysis to visualize a breakdown of U.S. GDP by industry in 2023. To show this, we use value added by industry, which reflects the difference between gross output and the cost of intermediate inputs.
The Top 10 U.S. Industries by GDP
As of Q1 2023, the annualized GDP of the U.S. sits at $26.5 trillion.
Of this, 88% or $23.5 trillion comes from private industries. The remaining $3 trillion is government spending at the federal, state, and local levels.
Here’s a look at the largest private industries by economic contribution in the United States:
| Industry | Annualized Nominal GDP (as of Q1 2023) | % of U.S. GDP |
|---|---|---|
| Professional and business services | $3.5T | 13% |
| Real estate, rental, and leasing | $3.3T | 12% |
| Manufacturing | $2.9T | 11% |
| Educational services, health care, and social assistance | $2.3T | 9% |
| Finance and insurance | $2.0T | 8% |
| Wholesale trade | $1.7T | 6% |
| Retail trade | $1.5T | 6% |
| Information | $1.5T | 6% |
| Arts, entertainment, recreation, accommodation, and food services | $1.2T | 4% |
| Construction | $1.1T | 4% |
| Other private industries | $2.6T | 10% |
| Total | $23.5T | 88% |
Like most other developed nations, the U.S. economy is largely based on services.
Service-based industries, including professional and business services, real estate, finance, and health care, make up the bulk (70%) of U.S. GDP. In comparison, goods-producing industries like agriculture, manufacturing, mining, and construction play a smaller role.
Professional and business services is the largest industry with $3.5 trillion in value added. It comprises establishments providing legal, consulting, design, administration, and other services. This is followed by real estate at $3.3 trillion, which has consistently been an integral part of the economy.
Due to outsourcing and other factors, the manufacturing industry’s share of GDP has been declining for decades, but it still remains a significant part of the economy. Manufacturing of durable goods (metals, machines, computers) accounts for $1.6 trillion in value added, alongside nondurable goods (food, petroleum, chemicals) at $1.3 trillion.
The Government’s Contribution to GDP
Just like private industries, the government’s value added to GDP consists of compensation of employees, taxes collected (less subsidies), and gross operating surplus.
| Government | Annualized Nominal GDP (as of Q1 2023) | % of U.S. GDP |
|---|---|---|
| State and Local | $2.1T | 8% |
| Federal | $0.9T | 4% |
| Total | $3.1T | 12% |
Figures may not add up to the total due to rounding.
State and local government spending, largely focused on the education and public welfare sectors, accounts for the bulk of value added. The Federal contribution to GDP amounts to roughly $948 billion, with 52% of it attributed to national defense.
The Fastest Growing Industries (2022–2032P)
In the next 10 years, services-producing industries are projected to see the fastest growth in output.
The table below shows the five fastest-growing industries in the U.S. from 2022–2032 in terms of total output, based on data from the Bureau of Labor Statistics:
| Industry | Sector | Compound Annual Rate of Output Growth (2022–2032P) |
|---|---|---|
| Software publishers | Information | 5.2% |
| Computing infrastructure providers, data processing, and related services | Information | 3.9% |
| Wireless telecommunications carriers (except satellite) | Information | 3.6% |
| Home health care services | Health care and social assistance | 3.6% |
| Oil and gas extraction | Mining | 3.5% |
Three of the fastest-growing industries are in the information sector, underscoring the growing role of technology and digital infrastructure. Meanwhile, the projected growth of the oil and gas extraction industry highlights the enduring demand for traditional energy sources, despite the energy transition.
Overall, the development of these industries suggests that the U.S. will continue its shift toward a services-oriented economy. But today, it’s also worth noticing how services- and goods-producing industries are increasingly tied together. For example, it’s now common for tech companies to produce devices, and for manufacturers to use software in their operations.
Therefore, the oncoming tide of growth in service-based industries could potentially lift other interconnected sectors of the diverse U.S. economy.


Markets
The European Stock Market: Attractive Valuations Offer Opportunities
On average, the European stock market has valuations that are nearly 50% lower than U.S. valuations. But how can you access the market?


European Stock Market: Attractive Valuations Offer Opportunities
Europe is known for some established brands, from L’Oréal to Louis Vuitton. However, the European stock market offers additional opportunities that may be lesser known.
The above infographic, sponsored by STOXX, outlines why investors may want to consider European stocks.
Attractive Valuations
Compared to most North American and Asian markets, European stocks offer lower or comparable valuations.
| Index | Price-to-Earnings Ratio | Price-to-Book Ratio |
|---|---|---|
| EURO STOXX 50 | 14.9 | 2.2 |
| STOXX Europe 600 | 14.4 | 2 |
| U.S. | 25.9 | 4.7 |
| Canada | 16.1 | 1.8 |
| Japan | 15.4 | 1.6 |
| Asia Pacific ex. China | 17.1 | 1.8 |
Data as of February 29, 2024. See graphic for full index names. Ratios based on trailing 12 month financials. The price to earnings ratio excludes companies with negative earnings.
On average, European valuations are nearly 50% lower than U.S. valuations, potentially offering an affordable entry point for investors.
Research also shows that lower price ratios have historically led to higher long-term returns.
Market Movements Not Closely Connected
Over the last decade, the European stock market had low-to-moderate correlation with North American and Asian equities.
The below chart shows correlations from February 2014 to February 2024. A value closer to zero indicates low correlation, while a value of one would indicate that two regions are moving in perfect unison.
| EURO STOXX 50 | STOXX EUROPE 600 | U.S. | Canada | Japan | Asia Pacific ex. China |
|
|---|---|---|---|---|---|---|
| EURO STOXX 50 | 1.00 | 0.97 | 0.55 | 0.67 | 0.24 | 0.43 |
| STOXX EUROPE 600 | 1.00 | 0.56 | 0.71 | 0.28 | 0.48 | |
| U.S. | 1.00 | 0.73 | 0.12 | 0.25 | ||
| Canada | 1.00 | 0.22 | 0.40 | |||
| Japan | 1.00 | 0.88 | ||||
| Asia Pacific ex. China | 1.00 |
Data is based on daily USD returns.
European equities had relatively independent market movements from North American and Asian markets. One contributing factor could be the differing sector weights in each market. For instance, technology makes up a quarter of the U.S. market, but health care and industrials dominate the broader European market.
Ultimately, European equities can enhance portfolio diversification and have the potential to mitigate risk for investors.
Tracking the Market
For investors interested in European equities, STOXX offers a variety of flagship indices:
| Index | Description | Market Cap |
|---|---|---|
| STOXX Europe 600 | Pan-regional, broad market | €10.5T |
| STOXX Developed Europe | Pan-regional, broad-market | €9.9T |
| STOXX Europe 600 ESG-X | Pan-regional, broad market, sustainability focus | €9.7T |
| STOXX Europe 50 | Pan-regional, blue-chip | €5.1T |
| EURO STOXX 50 | Eurozone, blue-chip | €3.5T |
Data is as of February 29, 2024. Market cap is free float, which represents the shares that are readily available for public trading on stock exchanges.
The EURO STOXX 50 tracks the Eurozone’s biggest and most traded companies. It also underlies one of the world’s largest ranges of ETFs and mutual funds. As of November 2023, there were €27.3 billion in ETFs and €23.5B in mutual fund assets under management tracking the index.
“For the past 25 years, the EURO STOXX 50 has served as an accurate, reliable and tradable representation of the Eurozone equity market.”
— Axel Lomholt, General Manager at STOXX
Partnering with STOXX to Track the European Stock Market
Are you interested in European equities? STOXX can be a valuable partner:
- Comprehensive, liquid and investable ecosystem
- European heritage, global reach
- Highly sophisticated customization capabilities
- Open architecture approach to using data
- Close partnerships with clients
- Part of ISS STOXX and Deutsche Börse Group
With a full suite of indices, STOXX can help you benchmark against the European stock market.
Learn how STOXX’s European indices offer liquid and effective market access.

-

 Economy2 days ago
Economic Growth Forecasts for G7 and BRICS Countries in 2024
The IMF has released its economic growth forecasts for 2024. How do the G7 and BRICS countries compare?
-

 Markets1 week ago
U.S. Debt Interest Payments Reach $1 Trillion
U.S. debt interest payments have surged past the $1 trillion dollar mark, amid high interest rates and an ever-expanding debt burden.
-

 United States2 weeks ago
Ranked: The Largest U.S. Corporations by Number of Employees
We visualized the top U.S. companies by employees, revealing the massive scale of retailers like Walmart, Target, and Home Depot.
-

 Markets2 weeks ago
The Top 10 States by Real GDP Growth in 2023
This graphic shows the states with the highest real GDP growth rate in 2023, largely propelled by the oil and gas boom.
-

 Markets2 weeks ago
Ranked: The World’s Top Flight Routes, by Revenue
In this graphic, we show the highest earning flight routes globally as air travel continued to rebound in 2023.
-

 Markets2 weeks ago
Ranked: The Most Valuable Housing Markets in America
The U.S. residential real estate market is worth a staggering $47.5 trillion. Here are the most valuable housing markets in the country.


-

 Education1 week ago
How Hard Is It to Get Into an Ivy League School?
-

 Technology2 weeks ago
Ranked: Semiconductor Companies by Industry Revenue Share
-
Markets2 weeks ago
Ranked: The World’s Top Flight Routes, by Revenue
-

 Demographics2 weeks ago
Population Projections: The World’s 6 Largest Countries in 2075
-
Markets2 weeks ago
The Top 10 States by Real GDP Growth in 2023
-

 Demographics2 weeks ago
The Smallest Gender Wage Gaps in OECD Countries
-

 Economy2 weeks ago
Where U.S. Inflation Hit the Hardest in March 2024
-

 Green2 weeks ago
Top Countries By Forest Growth Since 2001