

Services-producing industries account for the majority of U.S. GDP in 2023, followed by other private industries and the government.
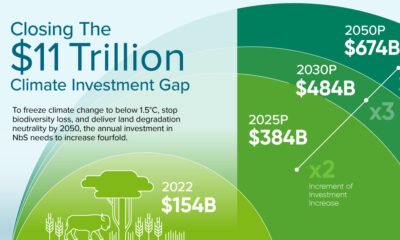

$11 trillion needs to be invested in nature-based solutions between 2022 and 2050 to combat climate change.
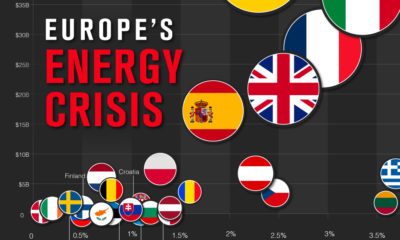

As European gas prices soar, countries are introducing policies to try and curb the energy crisis.
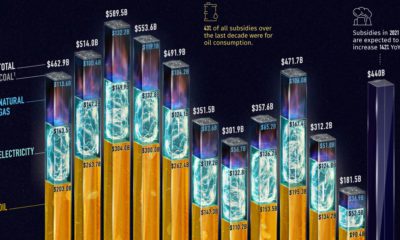

Governments pour nearly $500 billion into fossil fuel subsidies annually. This chart breaks down fossil fuel subsidies between 2010 and 2021.
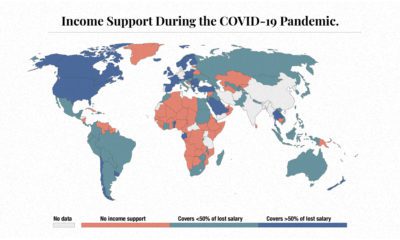

The need for income support during COVID-19 has been vast. This map visualizes different levels of income support around the world.
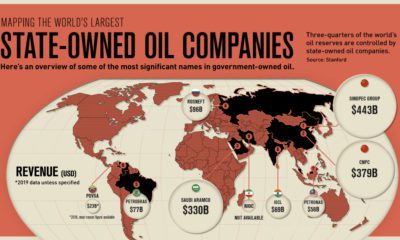

State-owned oil companies control roughly three-quarters of global oil supply. See how these companies compare in this infographic.
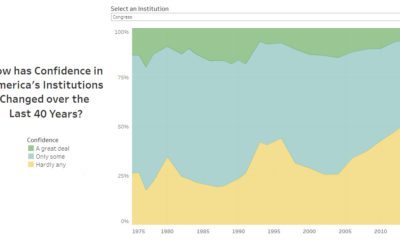

Americans rely on several institutions for their services and safety—but how has their confidence in institutions changed since 1975?
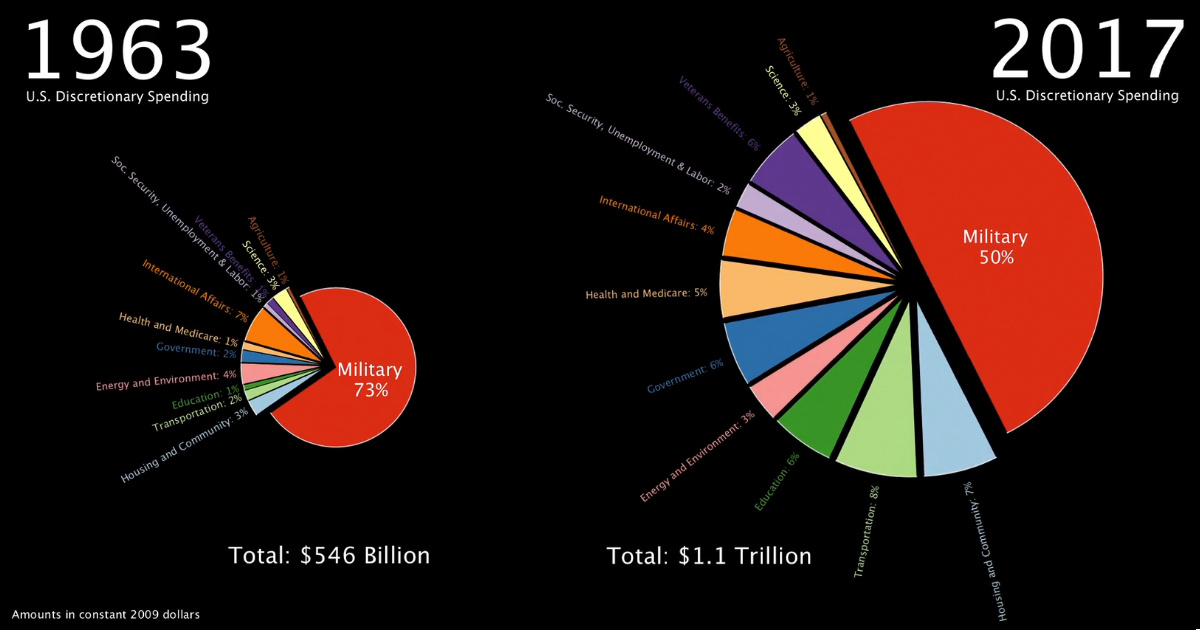
This stunning one minute animation breaks down U.S. government discretionary spending from 1963 all the way until today.
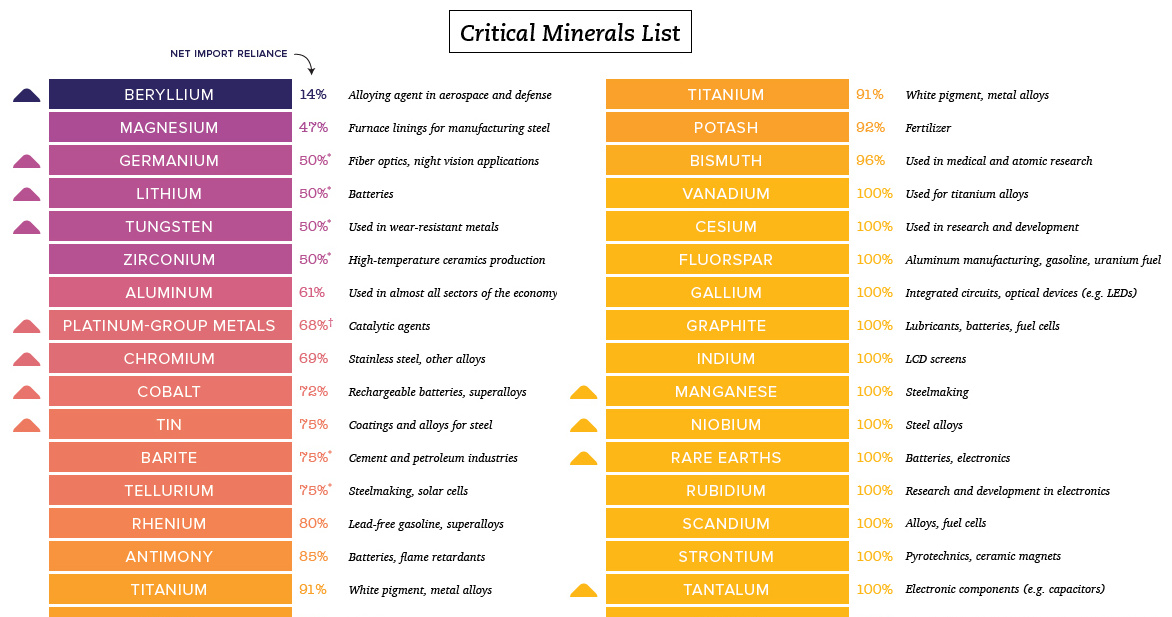
These critical minerals are needed for tech, defense, and industry, yet most of them are mainly imported from outside of the United States.
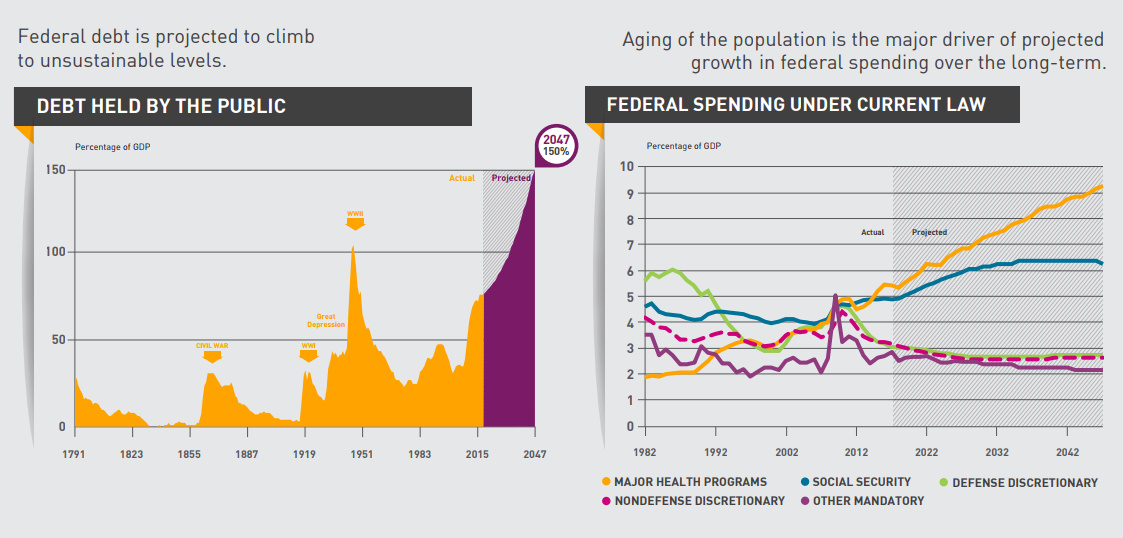
The national debt keeps growing and growing. But what's driving that trend, and when will the situation reach a critical mass of attention?


