Energy
Visualizing the Scale of Global Fossil Fuel Production
![]() Subscribe to the Elements free mailing list for more like this
Subscribe to the Elements free mailing list for more like this


The Scale of Global Fossil Fuel Production
This was originally posted on Elements. Sign up to the free mailing list to get beautiful visualizations on natural resource megatrends in your email every week.
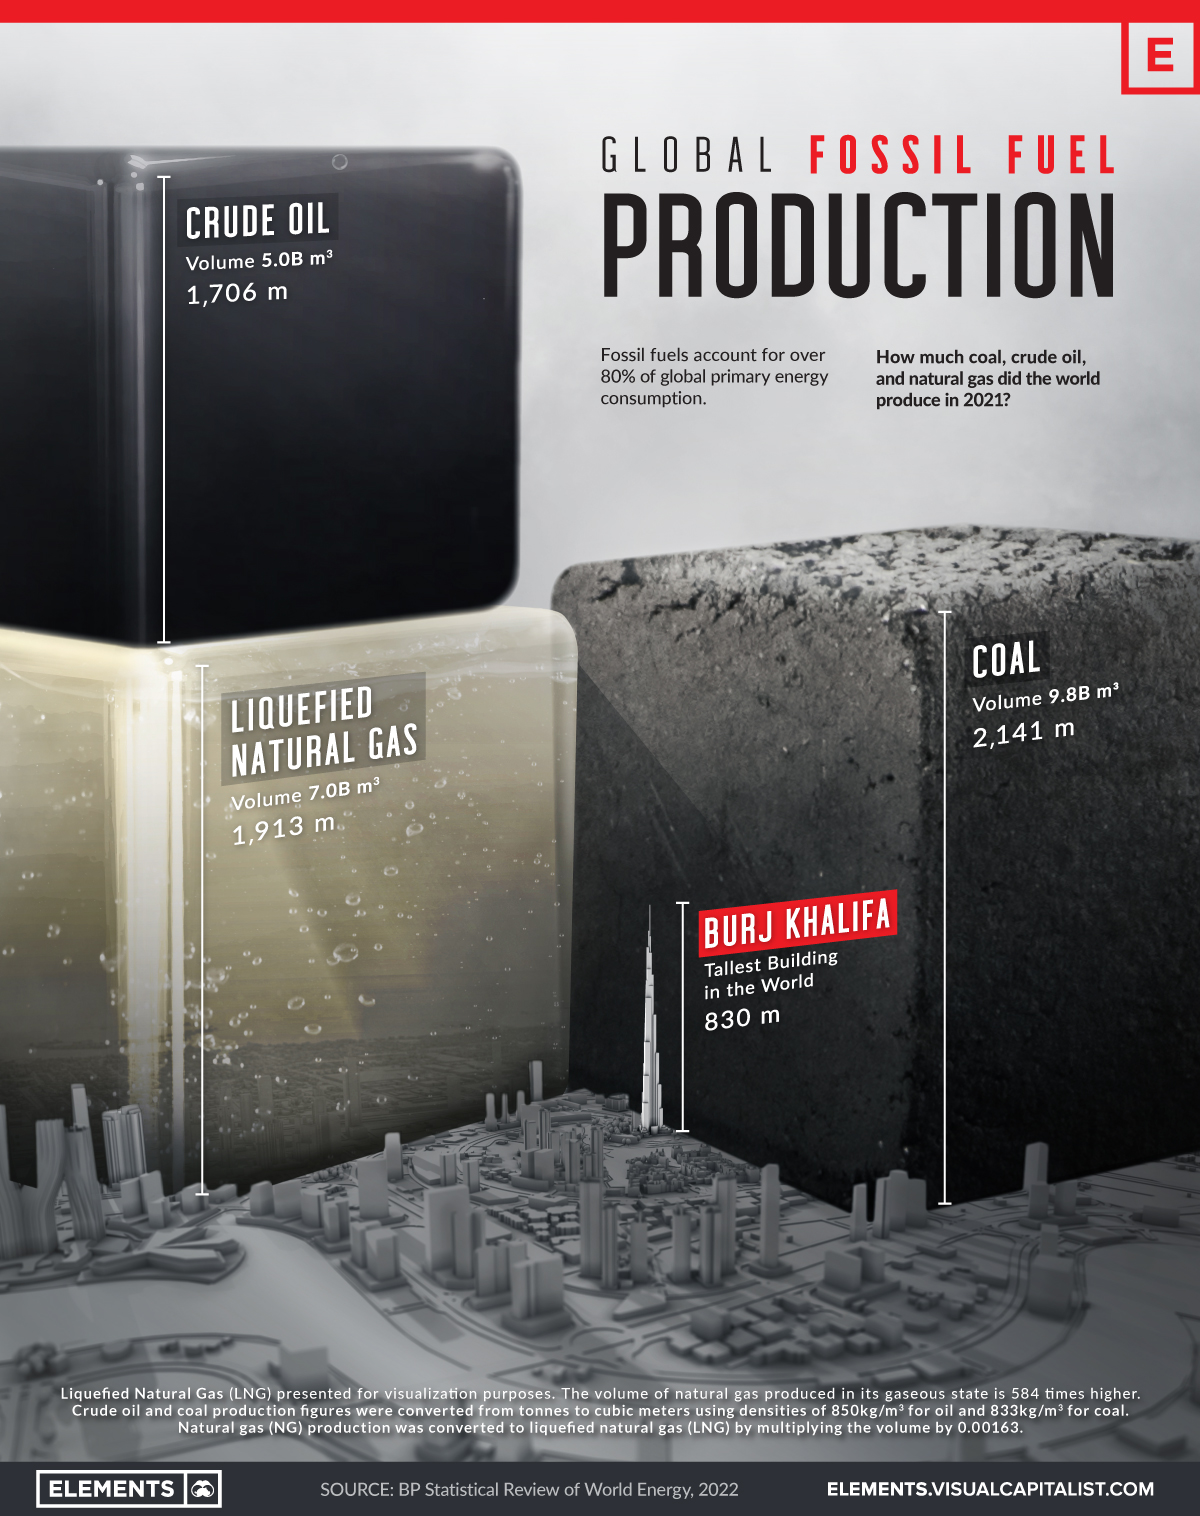
Fossil fuels have been our predominant source of energy for over a century, and the world still extracts and consumes a colossal amount of coal, oil, and gas every year.
This infographic visualizes the volume of global fossil fuel production in 2021 using data from BP’s Statistical Review of World Energy.
The Facts on Fossil Fuels
In 2021, the world produced around 8 billion tonnes of coal, 4 billion tonnes of oil, and over 4 trillion cubic meters of natural gas.
Most of the coal is used to generate electricity for our homes and offices and has a key role in steel production. Similarly, natural gas is a large source of electricity and heat for industries and buildings. Oil is primarily used by the transportation sector, in addition to petrochemical manufacturing, heating, and other end uses.
Here’s a full breakdown of coal, oil, and gas production by country in 2021.
Coal Production
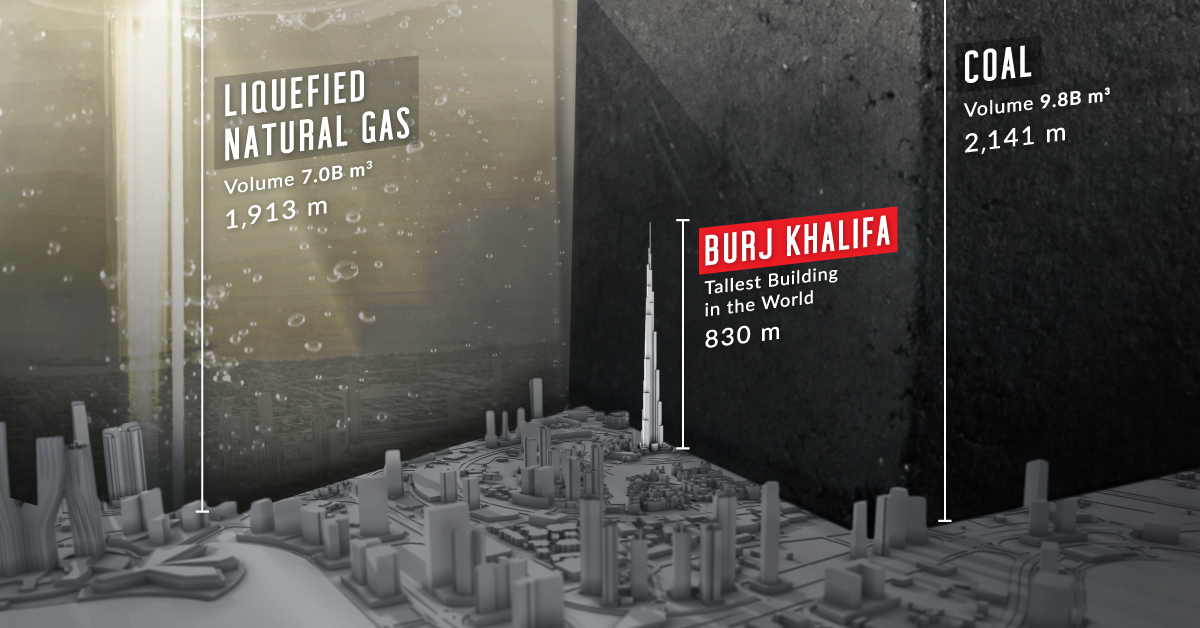
If all the coal produced in 2021 were arranged in a cube, it would measure 2,141 meters (2.1km) on each side—more than 2.5 times the height of the world’s tallest building.
China produced 50% or more than four billion tonnes of the world’s coal in 2021. It’s also the largest consumer of coal, accounting for 54% of coal consumption in 2021.
| Rank | Country | 2021 Coal Production (million tonnes) | % of Total |
|---|---|---|---|
| #1 | 🇨🇳 China | 4,126.0 | 50% |
| #2 | 🇮🇳 India | 811.3 | 10% |
| #3 | 🇮🇩 Indonesia | 614.0 | 8% |
| #4 | 🇺🇸 U.S. | 524.4 | 6% |
| #5 | 🇦🇺 Australia | 478.6 | 6% |
| #6 | 🇷🇺 Russia | 433.7 | 5% |
| #7 | 🇿🇦 South Africa | 234.5 | 3% |
| #8 | 🇩🇪 Germany | 126.0 | 2% |
| #9 | 🇰🇿 Kazakhstan | 115.7 | 1% |
| #10 | 🇵🇱 Poland | 107.6 | 1% |
| 🌍 Other | 600.9 | 7% | |
| Total | 8,172.6 | 100% |
India is both the second largest producer and consumer of coal. Meanwhile, Indonesia is the world’s largest coal exporter, followed by Australia.
In the West, U.S. coal production was down 47% as compared to 2011 levels, and the descent is likely to continue with the clean energy transition.
Oil Production
In 2021, the United States, Russia, and Saudi Arabia were the three largest crude oil producers, respectively.
| Rank | Country | 2021 Oil Production (million tonnes) | % of Total |
|---|---|---|---|
| #1 | 🇺🇸 U.S. | 711.1 | 17% |
| #2 | 🇷🇺 Russia | 536.4 | 13% |
| #3 | 🇸🇦 Saudi Arabia | 515.0 | 12% |
| #4 | 🇨🇦 Canada | 267.1 | 6% |
| #5 | 🇮🇶 Iraq | 200.8 | 5% |
| #6 | 🇨🇳 China | 198.9 | 5% |
| #7 | 🇮🇷 Iran | 167.7 | 4% |
| #8 | 🇦🇪 UAE | 164.4 | 4% |
| #9 | 🇧🇷 Brazil | 156.8 | 4% |
| #10 | 🇰🇼 Kuwait | 131.1 | 3% |
| 🌍 Other | 1172.0 | 28% | |
| Total | 4221.4 | 100% |
OPEC countries, including Saudi Arabia, made up the largest share of production at 35% or 1.5 billion tonnes of oil.
U.S. oil production has seen significant growth since 2010. In 2021, the U.S. extracted 711 million tonnes of oil, more than double the 333 million tonnes produced in 2010.
Natural Gas Production
The world produced 4,036 billion cubic meters of natural gas in 2021. The above graphic converts that into an equivalent of seven billion cubic meters of liquefied natural gas (LNG) to visualize it on the same scale as oil and gas.
Here are the top 10 producers of natural gas in 2021:
| Rank | Country | 2021 Natural Gas Production (billion m3) | % of Total |
|---|---|---|---|
| #1 | 🇺🇸 U.S. | 934.2 | 23% |
| #2 | 🇷🇺 Russia | 701.7 | 17% |
| #3 | 🇮🇷 Iran | 256.7 | 6% |
| #4 | 🇨🇳 China | 209.2 | 5% |
| #5 | 🇶🇦 Qatar | 177.0 | 4% |
| #6 | 🇨🇦 Canada | 172.3 | 4% |
| #7 | 🇦🇺 Australia | 147.2 | 4% |
| #8 | 🇸🇦 Saudi Arabia | 117.3 | 3% |
| #9 | 🇳🇴 Norway | 114.3 | 3% |
| #10 | 🇩🇿 Algeria | 100.8 | 2% |
| 🌍 Other | 1106.3 | 27% | |
| Total | 4,036.9 | 100% |
The U.S. was the largest producer, with Texas and Pennsylvania accounting for 47% of its gas production. The U.S. electric power and industrial sectors account for around one-third of domestic natural gas consumption.
Russia, the next-largest producer, was the biggest exporter of gas in 2021. It exported an estimated 210 billion cubic meters of natural gas via pipelines to Europe and China. Around 80% of Russian natural gas comes from operations in the Arctic region.


Who’s Building the Most Solar Energy?
This was originally posted on our Voronoi app. Download the app for free on iOS or Android and discover incredible data-driven charts from a variety of trusted sources.
In 2023, solar energy accounted for three-quarters of renewable capacity additions worldwide. Most of this growth occurred in Asia, the EU, and the U.S., continuing a trend observed over the past decade.
In this graphic, we illustrate the rise in installed solar photovoltaic (PV) capacity in China, the EU, and the U.S. between 2010 and 2022, measured in gigawatts (GW). Bruegel compiled the data..
Chinese Dominance
As of 2022, China’s total installed capacity stands at 393 GW, nearly double that of the EU’s 205 GW and surpassing the USA’s total of 113 GW by more than threefold in absolute terms.
| Installed solar capacity (GW) | China | EU27 | U.S. |
|---|---|---|---|
| 2022 | 393.0 | 205.5 | 113.0 |
| 2021 | 307.0 | 162.7 | 95.4 |
| 2020 | 254.0 | 136.9 | 76.4 |
| 2019 | 205.0 | 120.1 | 61.6 |
| 2018 | 175.3 | 104.0 | 52.0 |
| 2017 | 130.8 | 96.2 | 43.8 |
| 2016 | 77.8 | 91.5 | 35.4 |
| 2015 | 43.6 | 87.7 | 24.2 |
| 2014 | 28.4 | 83.6 | 18.1 |
| 2013 | 17.8 | 79.7 | 13.3 |
| 2012 | 6.7 | 71.1 | 8.6 |
| 2011 | 3.1 | 53.3 | 5.6 |
| 2010 | 1.0 | 30.6 | 3.4 |
Since 2017, China has shown a compound annual growth rate (CAGR) of approximately 25% in installed PV capacity, while the USA has seen a CAGR of 21%, and the EU of 16%.
Additionally, China dominates the production of solar power components, currently controlling around 80% of the world’s solar panel supply chain.
In 2022, China’s solar industry employed 2.76 million individuals, with manufacturing roles representing approximately 1.8 million and the remaining 918,000 jobs in construction, installation, and operations and maintenance.
The EU industry employed 648,000 individuals, while the U.S. reached 264,000 jobs.
According to the IEA, China accounts for almost 60% of new renewable capacity expected to become operational globally by 2028.
Despite the phasing out of national subsidies in 2020 and 2021, deployment of solar PV in China is accelerating. The country is expected to reach its national 2030 target for wind and solar PV installations in 2024, six years ahead of schedule.

-

 Markets5 days ago
Mapped: The Most Valuable Company in Each Southeast Asian Country
-

 Markets2 weeks ago
The Top Private Equity Firms by Country
-

 Jobs2 weeks ago
The Best U.S. Companies to Work for According to LinkedIn
-

 Economy2 weeks ago
Ranked: The Top 20 Countries in Debt to China
-

 Politics1 week ago
Charted: Trust in Government Institutions by G7 Countries
-

 Energy1 week ago
Mapped: The Age of Energy Projects in Interconnection Queues, by State
-

 Mining1 week ago
Visualizing Global Gold Production in 2023
-

 Markets1 week ago
Visualized: Interest Rate Forecasts for Advanced Economies