Energy
Visualizing U.S. Consumption of Fuel and Materials per Capita
![]() Subscribe to the Elements free mailing list for more like this
Subscribe to the Elements free mailing list for more like this
Visualizing U.S. Consumption of Fuel and Materials per Capita
This was originally posted on Elements. Sign up to the free mailing list to get beautiful visualizations on natural resource megatrends in your email every week.
Wealthy countries consume massive amounts of natural resources per capita, and the United States is no exception.
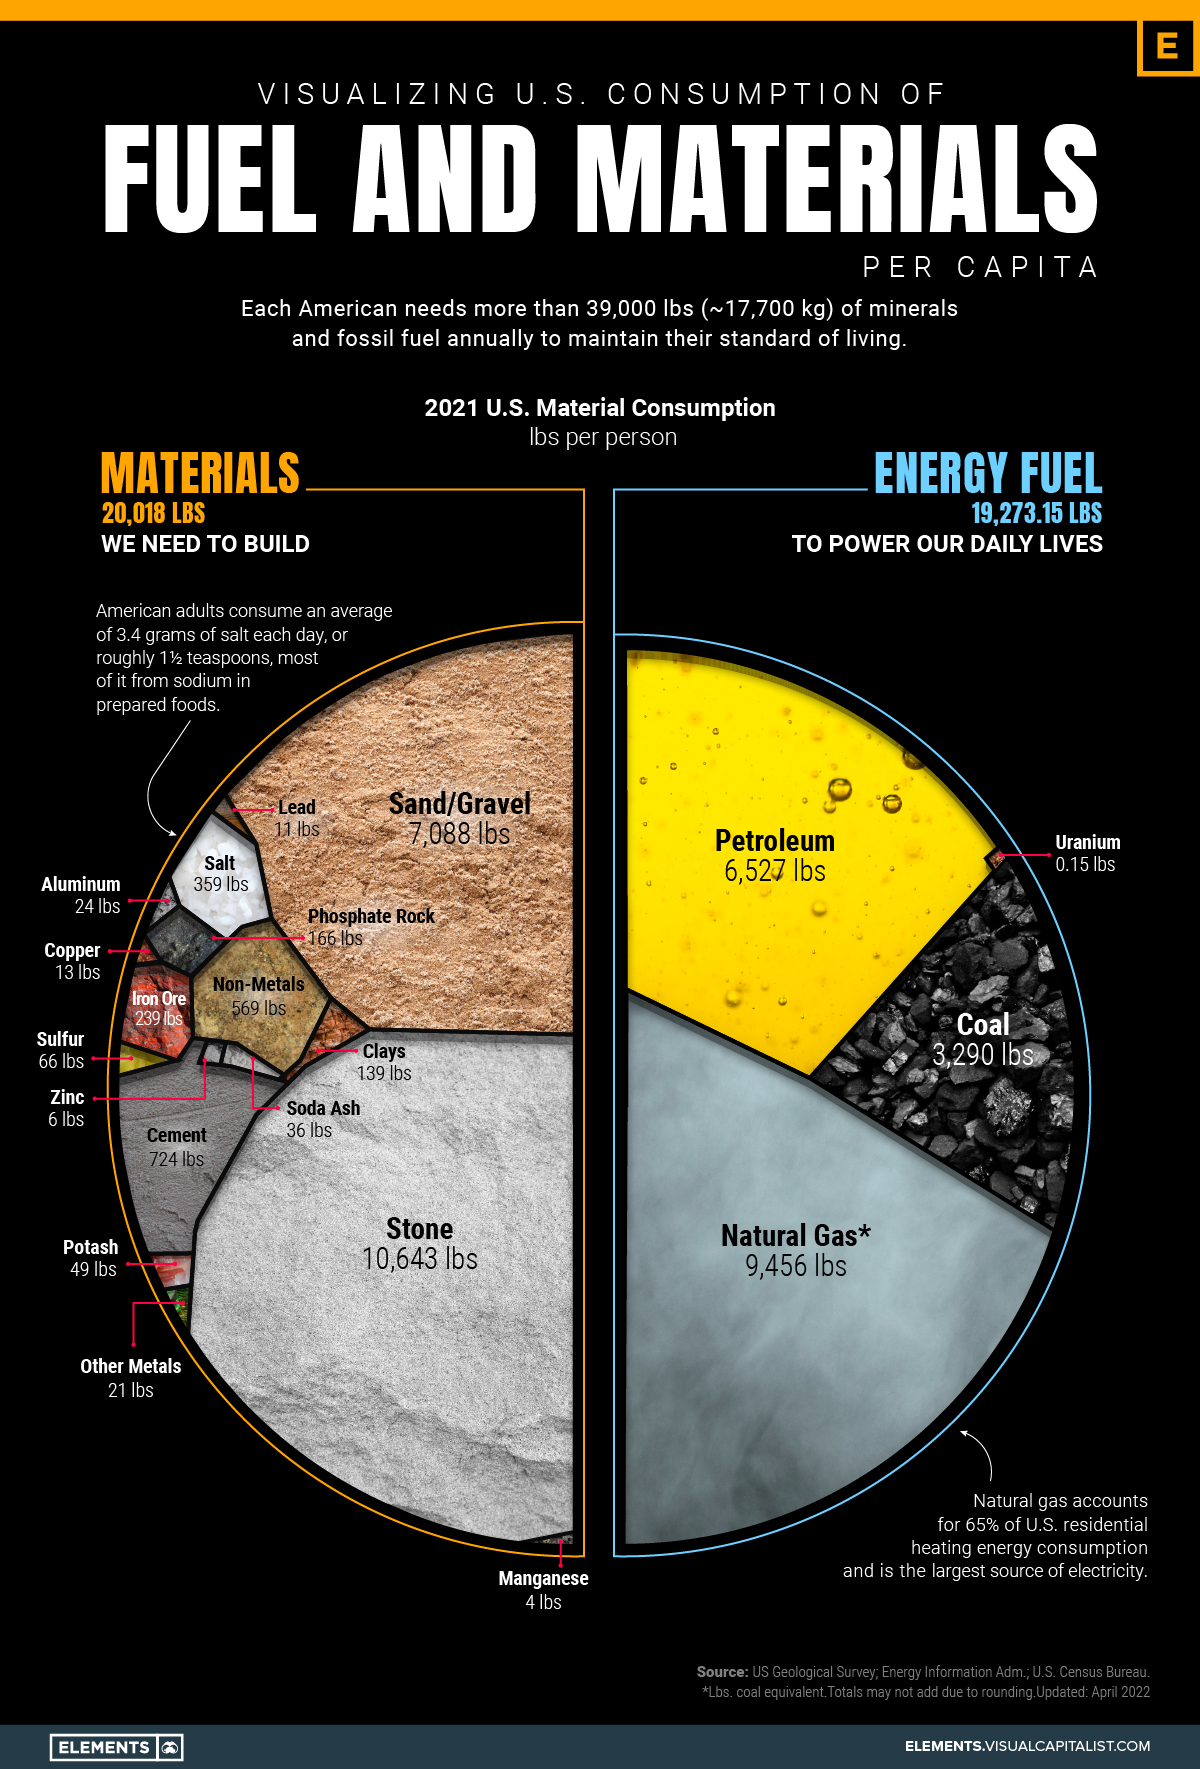
According to data from the National Mining Association, each American needs more than 39,000 pounds (17,700 kg) of minerals and fossil fuels annually to maintain their standard of living.
Materials We Need to Build
Every building around us and every sidewalk we walk on is made of sand, steel, and cement.
As a result, these materials lead consumption per capita in the United States. On average, each person in America drives the demand of over 10,000 lbs of stone and around 7,000 lbs of sand and gravel per year.
| Material/Fossil Fuel | Pounds Per Person |
|---|---|
| Stone | 10,643 |
| Natural Gas | 9,456 |
| Sand, Gravel | 7,088 |
| Petroleum Products | 6,527 |
| Coal | 3,290 |
| Cement | 724 |
| Other Nonmetals | 569 |
| Salt | 359 |
| Iron Ore | 239 |
| Phosphate Rock | 166 |
| Sulfur | 66 |
| Potash | 49 |
| Soda Ash | 36 |
| Bauxite (Aluminum) | 24 |
| Other Metals | 21 |
| Copper | 13 |
| Lead | 11 |
| Zinc | 6 |
| Manganese | 4 |
| Total | 39,291 |
The construction industry is a major contributor to the U.S. economy.
Crushed stone, sand, gravel, and other construction aggregates represent half of the industrial minerals produced in the country, resulting in $29 billion in revenue per year.
Also on the list are crucial hard metals such as copper, aluminum, iron ore, and of course many rarer metals used in smaller quantities each year. These rarer metals can make a big economic difference even when their uses are more concentrated and isolated—for example, palladium (primarily used in catalytic converters) costs $54 million per tonne.
Fuels Powering our Lives
Despite ongoing efforts to fight climate change and reduce carbon emissions, each person in the U.S. uses over 19,000 lbs of fossil fuels per year.
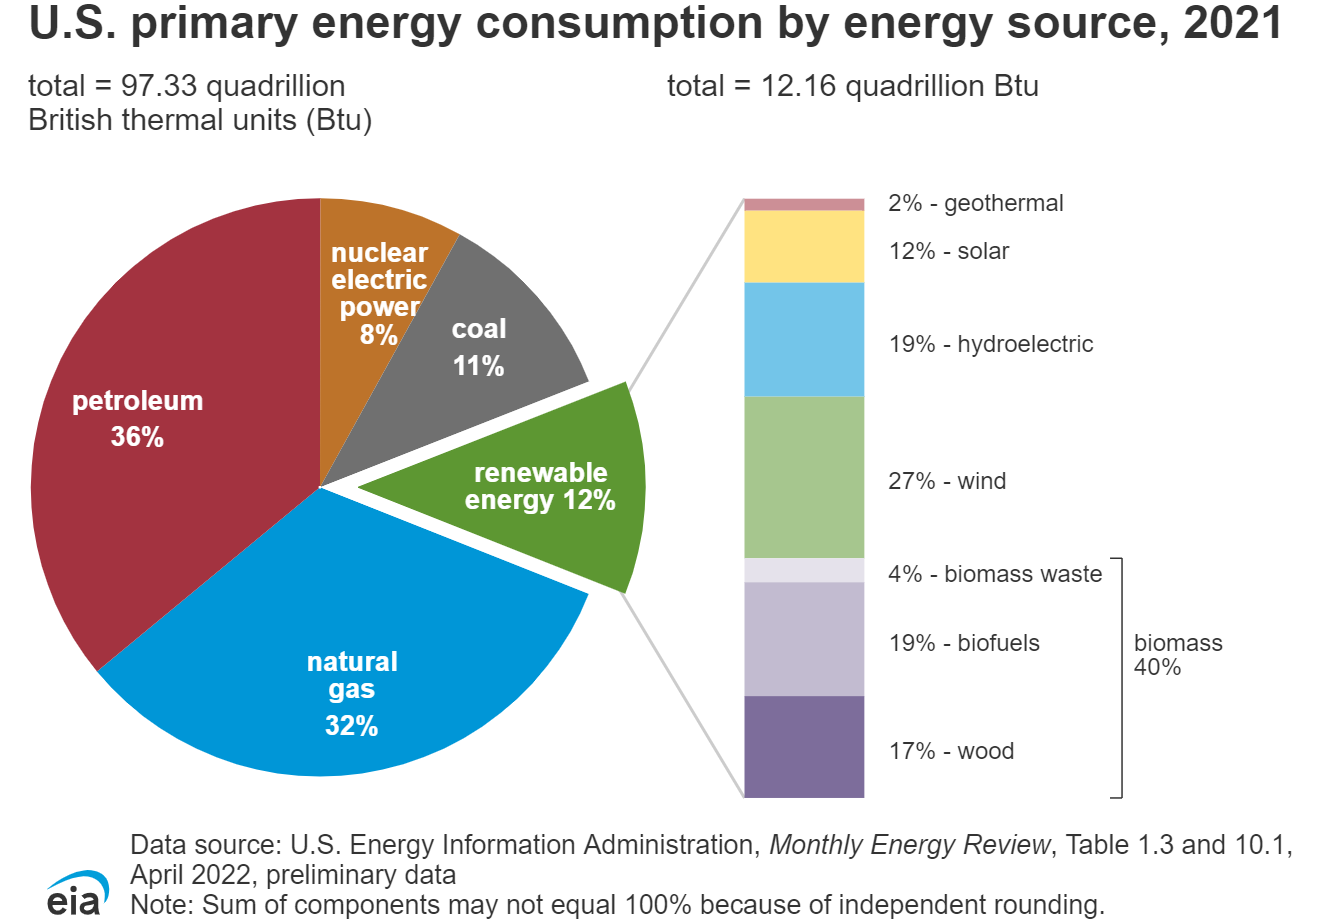
Gasoline is the most consumed petroleum product in the United States.
In 2021, finished motor gasoline consumption averaged about 369 million gallons per day, equal to about 44% of total U.S. petroleum use. Distillate fuel oil (20%), hydrocarbon gas liquids (17%), and jet fuel (7%) were the next most important uses.
Reliance on Other Countries
Over the past three decades, the United States has become reliant on foreign sources to meet domestic demand for minerals and fossil fuels. Today, the country is 100% import-reliant for 17 mineral commodities and at least 50% for 30 others.
In order to reduce the dependency on other countries, namely China, the Biden administration has been working to diversify supply chains in critical minerals. This includes strengthening alliances with other countries such as Australia, India, and Japan.
However, questions still remain about how soon these policies can make an impact, and the degree to which they can ultimately help localize and diversify supply chains.


Energy
Charted: 4 Reasons Why Lithium Could Be the Next Gold Rush
Visual Capitalist has partnered with EnergyX to show why drops in prices and growing demand may make now the right time to invest in lithium.


4 Reasons Why You Should Invest in Lithium
Lithium’s importance in powering EVs makes it a linchpin of the clean energy transition and one of the world’s most precious minerals.
In this graphic, Visual Capitalist partnered with EnergyX to explore why now may be the time to invest in lithium.
1. Lithium Prices Have Dropped
One of the most critical aspects of evaluating an investment is ensuring that the asset’s value is higher than its price would indicate. Lithium is integral to powering EVs, and, prices have fallen fast over the last year:
| Date | LiOH·H₂O* | Li₂CO₃** |
|---|---|---|
| Feb 2023 | $76 | $71 |
| March 2023 | $71 | $61 |
| Apr 2023 | $43 | $33 |
| May 2023 | $43 | $33 |
| June 2023 | $47 | $45 |
| July 2023 | $44 | $40 |
| Aug 2023 | $35 | $35 |
| Sept 2023 | $28 | $27 |
| Oct 2023 | $24 | $23 |
| Nov 2023 | $21 | $21 |
| Dec 2023 | $17 | $16 |
| Jan 2024 | $14 | $15 |
| Feb 2024 | $13 | $14 |
Note: Monthly spot prices were taken as close to the 14th of each month as possible.
*Lithium hydroxide monohydrate MB-LI-0033
**Lithium carbonate MB-LI-0029
2. Lithium-Ion Battery Prices Are Also Falling
The drop in lithium prices is just one reason to invest in the metal. Increasing economies of scale, coupled with low commodity prices, have caused the cost of lithium-ion batteries to drop significantly as well.
In fact, BNEF reports that between 2013 and 2023, the price of a Li-ion battery dropped by 82%.
| Year | Price per KWh |
|---|---|
| 2023 | $139 |
| 2022 | $161 |
| 2021 | $150 |
| 2020 | $160 |
| 2019 | $183 |
| 2018 | $211 |
| 2017 | $258 |
| 2016 | $345 |
| 2015 | $448 |
| 2014 | $692 |
| 2013 | $780 |

3. EV Adoption is Sustainable
One of the best reasons to invest in lithium is that EVs, one of the main drivers behind the demand for lithium, have reached a price point similar to that of traditional vehicle.
According to the Kelly Blue Book, Tesla’s average transaction price dropped by 25% between 2022 and 2023, bringing it in line with many other major manufacturers and showing that EVs are a realistic transport option from a consumer price perspective.
| Manufacturer | September 2022 | September 2023 |
|---|---|---|
| BMW | $69,000 | $72,000 |
| Ford | $54,000 | $56,000 |
| Volkswagon | $54,000 | $56,000 |
| General Motors | $52,000 | $53,000 |
| Tesla | $68,000 | $51,000 |
4. Electricity Demand in Transport is Growing
As EVs become an accessible transport option, there’s an investment opportunity in lithium. But possibly the best reason to invest in lithium is that the IEA reports global demand for the electricity in transport could grow dramatically by 2030:
| Transport Type | 2022 | 2025 | 2030 |
|---|---|---|---|
| Buses 🚌 | 23,000 GWh | 50,000 GWh | 130,000 GWh |
| Cars 🚙 | 65,000 GWh | 200,000 GWh | 570,000 GWh |
| Trucks 🛻 | 4,000 GWh | 15,000 GWh | 94,000 GWh |
| Vans 🚐 | 6,000 GWh | 16,000 GWh | 72,000 GWh |
The Lithium Investment Opportunity
Lithium presents a potentially classic investment opportunity. Lithium and battery prices have dropped significantly, and recently, EVs have reached a price point similar to other vehicles. By 2030, the demand for clean energy, especially in transport, will grow dramatically.
With prices dropping and demand skyrocketing, now is the time to invest in lithium.
EnergyX is poised to exploit lithium demand with cutting-edge lithium extraction technology capable of extracting 300% more lithium than current processes.

-

 Lithium5 days ago
Ranked: The Top 10 EV Battery Manufacturers in 2023
Asia dominates this ranking of the world’s largest EV battery manufacturers in 2023.
-

 Energy1 week ago
The World’s Biggest Nuclear Energy Producers
China has grown its nuclear capacity over the last decade, now ranking second on the list of top nuclear energy producers.
-

 Energy1 month ago
The World’s Biggest Oil Producers in 2023
Just three countries accounted for 40% of global oil production last year.
-

 Energy1 month ago
How Much Does the U.S. Depend on Russian Uranium?
Currently, Russia is the largest foreign supplier of nuclear power fuel to the U.S.
-

 Uranium2 months ago
Charted: Global Uranium Reserves, by Country
We visualize the distribution of the world’s uranium reserves by country, with 3 countries accounting for more than half of total reserves.
-

 Energy3 months ago
Visualizing the Rise of the U.S. as Top Crude Oil Producer
Over the last decade, the United States has established itself as the world’s top producer of crude oil, surpassing Saudi Arabia and Russia.


-

 Science1 week ago
Visualizing the Average Lifespans of Mammals
-

 Demographics2 weeks ago
The Smallest Gender Wage Gaps in OECD Countries
-

 United States2 weeks ago
Where U.S. Inflation Hit the Hardest in March 2024
-

 Green2 weeks ago
Top Countries By Forest Growth Since 2001
-

 United States2 weeks ago
Ranked: The Largest U.S. Corporations by Number of Employees
-

 Maps2 weeks ago
The Largest Earthquakes in the New York Area (1970-2024)
-

 Green2 weeks ago
Ranked: The Countries With the Most Air Pollution in 2023
-

 Green2 weeks ago
Ranking the Top 15 Countries by Carbon Tax Revenue