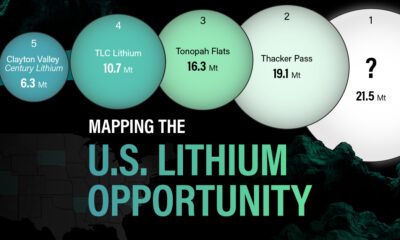

In this graphic, Visual Capitalist partnerered with EnergyX to explore the size and location of U.S. lithium mines.
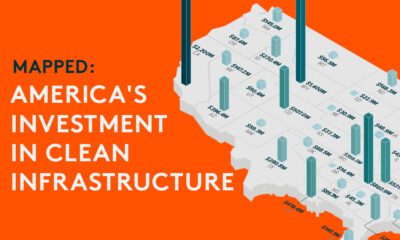

This graphic shows high levels of investment in U.S. clean infrastructure between 2021 and 2023.
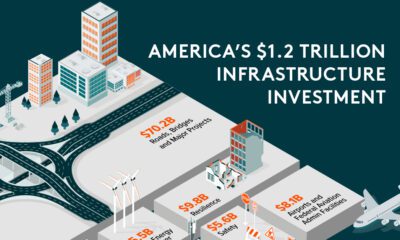

Graphic showing U.S. infrastructure investment highlighting that investment is primarily going to roads, bridges, and other major projects.
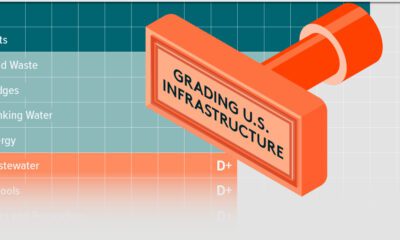

This graphic shows U.S infrastructure grades and highlights the general low grade.


Empower explores the roadblocks and stressors faced by Americans on the road to financial happiness.
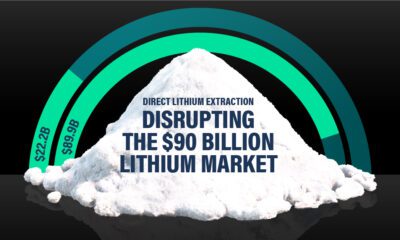

Visual Capitalist and EnergyX explore how direct lithium extraction could disrupt the $90B lithium industry.
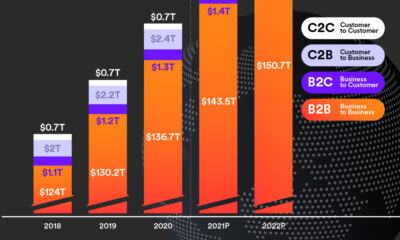

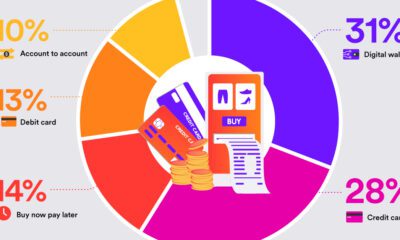
Cross-border payments grew to $150 trillion in 2022—nearly 30x the size of the global tech industry—and could hit $250 trillion by 2027.
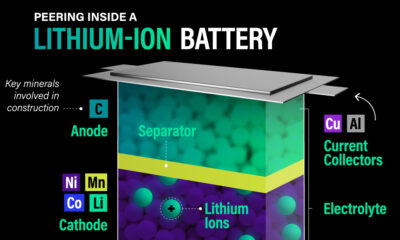

Lithium-ion batteries are critical for many modern technologies, from smartphones to smart cities. Here's how this critical technology works.
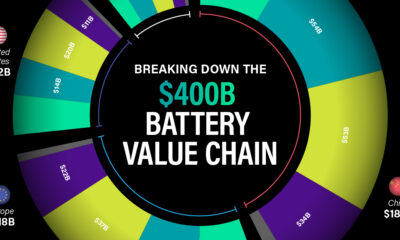

In this graphic, we break down where the $400 billion lithium battery industry will generate revenue in 2030.
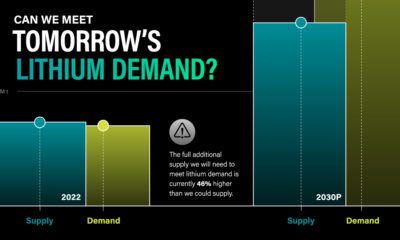

This graphic shows that demand for lithium will outstrip supply by 46%. But direct lithium extraction could be a solution to this problem.
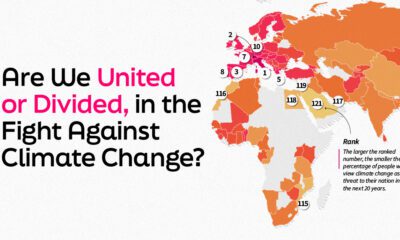

This graphic explores 121 nations thoughts on climate change and ranks them by the volume of their population who views it as a threat.
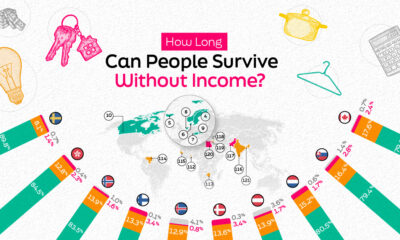

Income security is critical in resilience. In this graphic, we explore how secure people are and how long they could live without income.
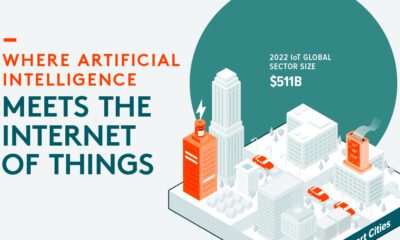

Explore the explosive growth of the Artificial Intelligence of Things (AIoT) industry and its transformative impact across sectors.
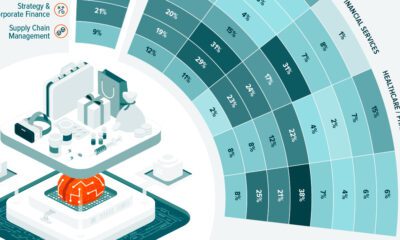

AI adoption impacts many industries, with finance leading. Discover how AI tools optimize operations, mitigate risks, and drive growth.
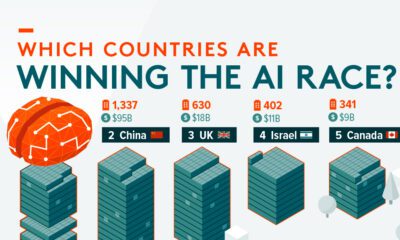

Find out which countries are winning the race when it comes to the number of AI startups and private investment .

Over 90% of businesses are adopting strategies of digital transformation to grow. Here are four strategies you can use.
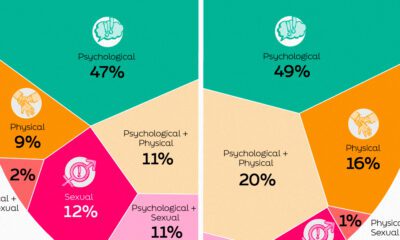

This infographic shows the types of workplace violence and harassment faced by people in the global workplace.
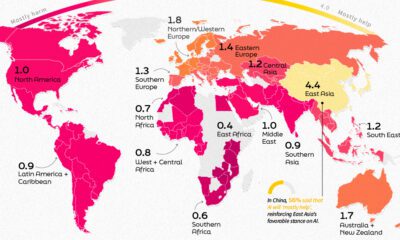

This infographic shows public perception of AI all over the globe and how this sentiment is affected by where you live.


Discover how the average person's carbon footprint impacts the environment and learn how carbon credits can offset your carbon footprint.
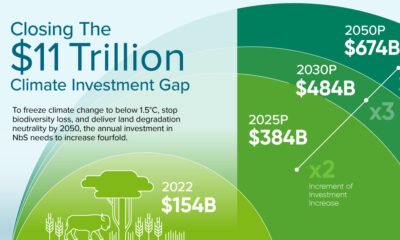

$11 trillion needs to be invested in nature-based solutions between 2022 and 2050 to combat climate change.


This graphic describes new U.S. renewable energy installations by state along with nameplate capacity, planned to come online in 2023.


