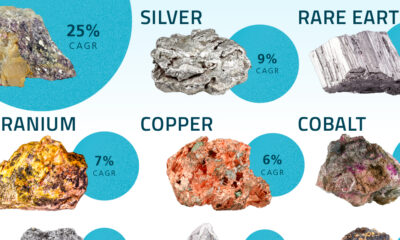

We’ve partnered with Sprott to visualize nine critical minerals for the clean energy transition and their projected compound annual growth rates between 2022–2027.
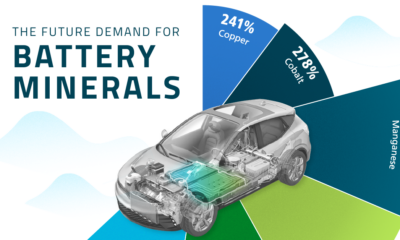

In this graphic, our sponsor Sprott examines the growth in demand for battery metals, as well as potential supply constraints.


In this graphic, we explore the projected generation capacity of different clean electricity technologies in the U.S. for 2023 and 2024.


Despite concerns about nuclear waste, high-level radioactive waste constitutes less than 0.25% of all radioactive waste ever generated.
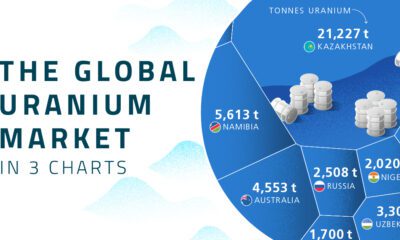

Four countries account for over 70% of global uranium production.


This infographic lists the top energy priorities in 28 countries, based on an Ipsos survey involving 24,000 people.


In this graphic, we visualize whether major electricity-consuming countries are on track to meet their 2030 renewable energy targets.
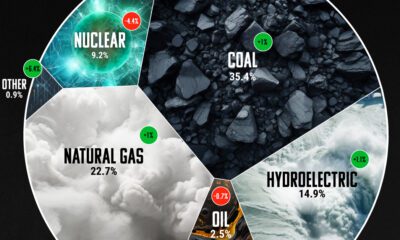

Coal still leads the charge when it comes to electricity, representing 35% of global power generation.
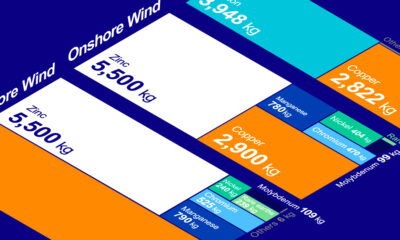

Metals are critical to the rollout of clean energy technologies like wind and solar, but just how much do they use?
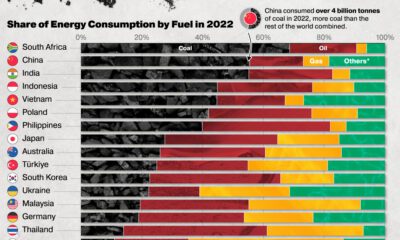

Global consumption of coal surpassed 8 billion tonnes per year for the first time in 2022. Here are the countries using the most coal.


