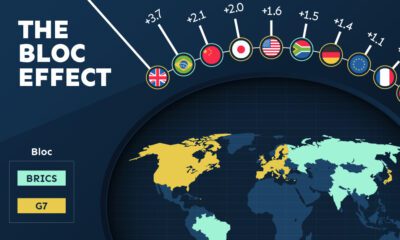

Rising geopolitical tensions are shaping the future of international trade, but what is the effect on trading among G7 and BRICS countries?


Tracking Gallup survey data for more than a decade reveals some countries are witnessing big happiness declines, reflecting their shifting socio-economic conditions.


One country is taking reforestation very seriously, registering more than 400,000 square km of forest growth in two decades.


See how the world's 6 largest countries will grow (or shrink) by 2075, based on the latest UN population projections.


Just three countries accounted for 40% of global oil production last year.


Advanced economies are the happiest countries for older people, likely due to their stronger social security systems.


While many inspiring teachings exist about attaining individual happiness, it's worthwhile to consider how happy entire countries are on a collective scale.


Heavily armed and armored, the modern tank is a versatile and mobile weapons platform, and a critical piece of contemporary warfare.
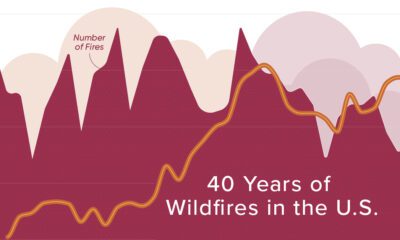

Wildfires are blazing across the U.S with unprecedented intensity. Here is how activity has evolved over four decades.


In 2023, nine of the top 10 best-selling vehicles in America were trucks or SUVs. This graphic shows the most popular vehicles overall.


