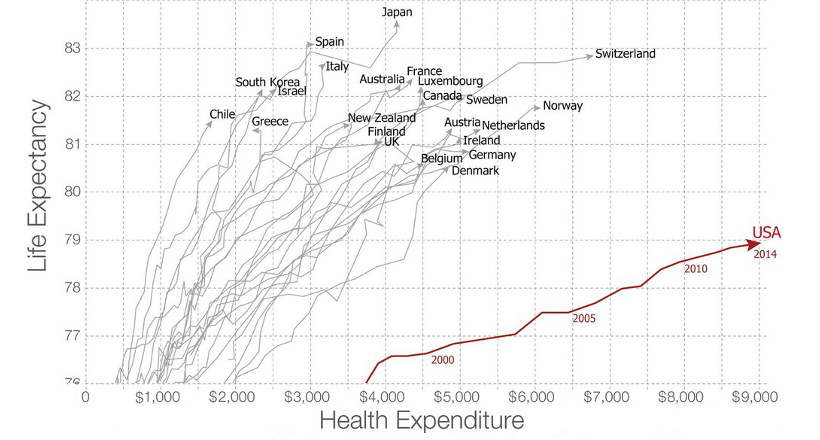
Americans spent more than $3 trillion, or 17.5% of GDP, on healthcare in 2015. Are they getting any bang for their buck?
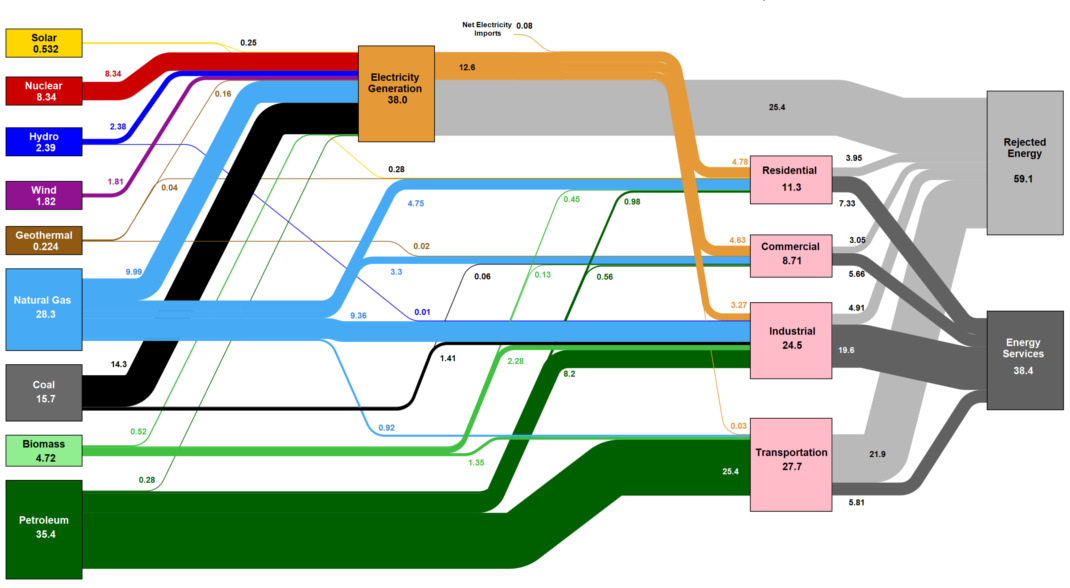
This massive diagram shows all energy created in the U.S., and where it goes. It's not sexy, but it gives a great 10,000 ft overview of...
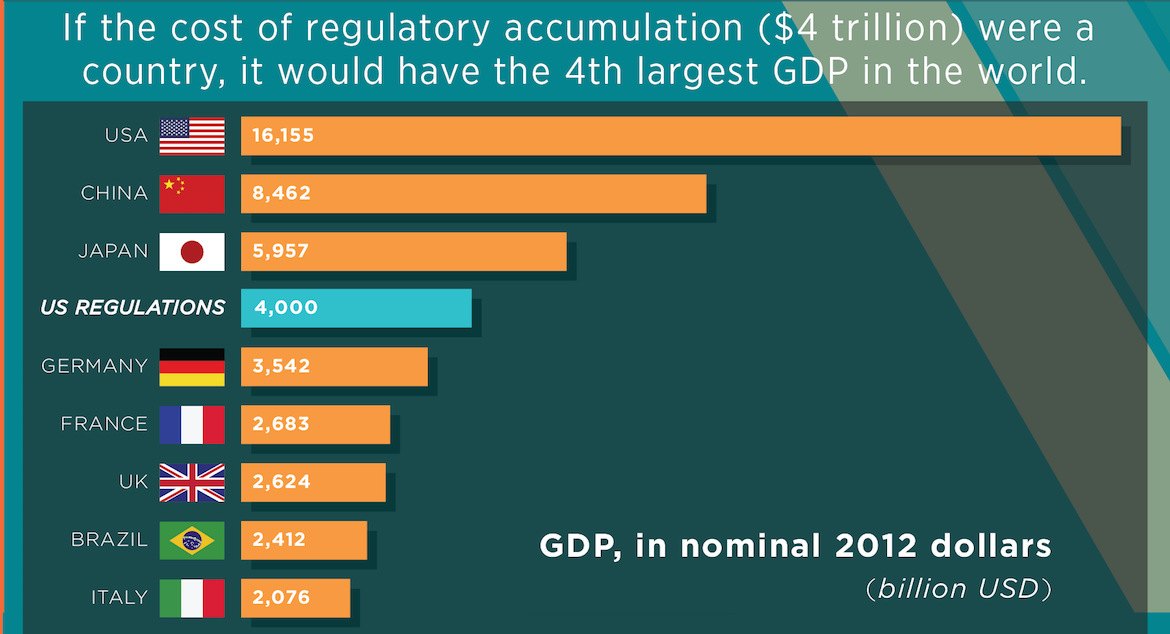
There is now a 180,000 page regulatory burden at the federal level, and one study finds the cumulative impact to be in the trillions.
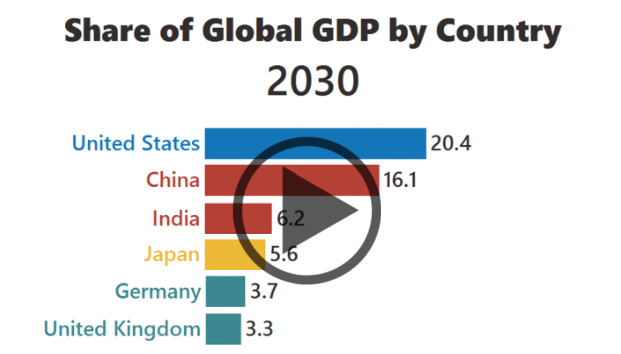
The rise of Asia has been swift. Here's three GIFs that show the speed of China in becoming an economic power house - and how India...
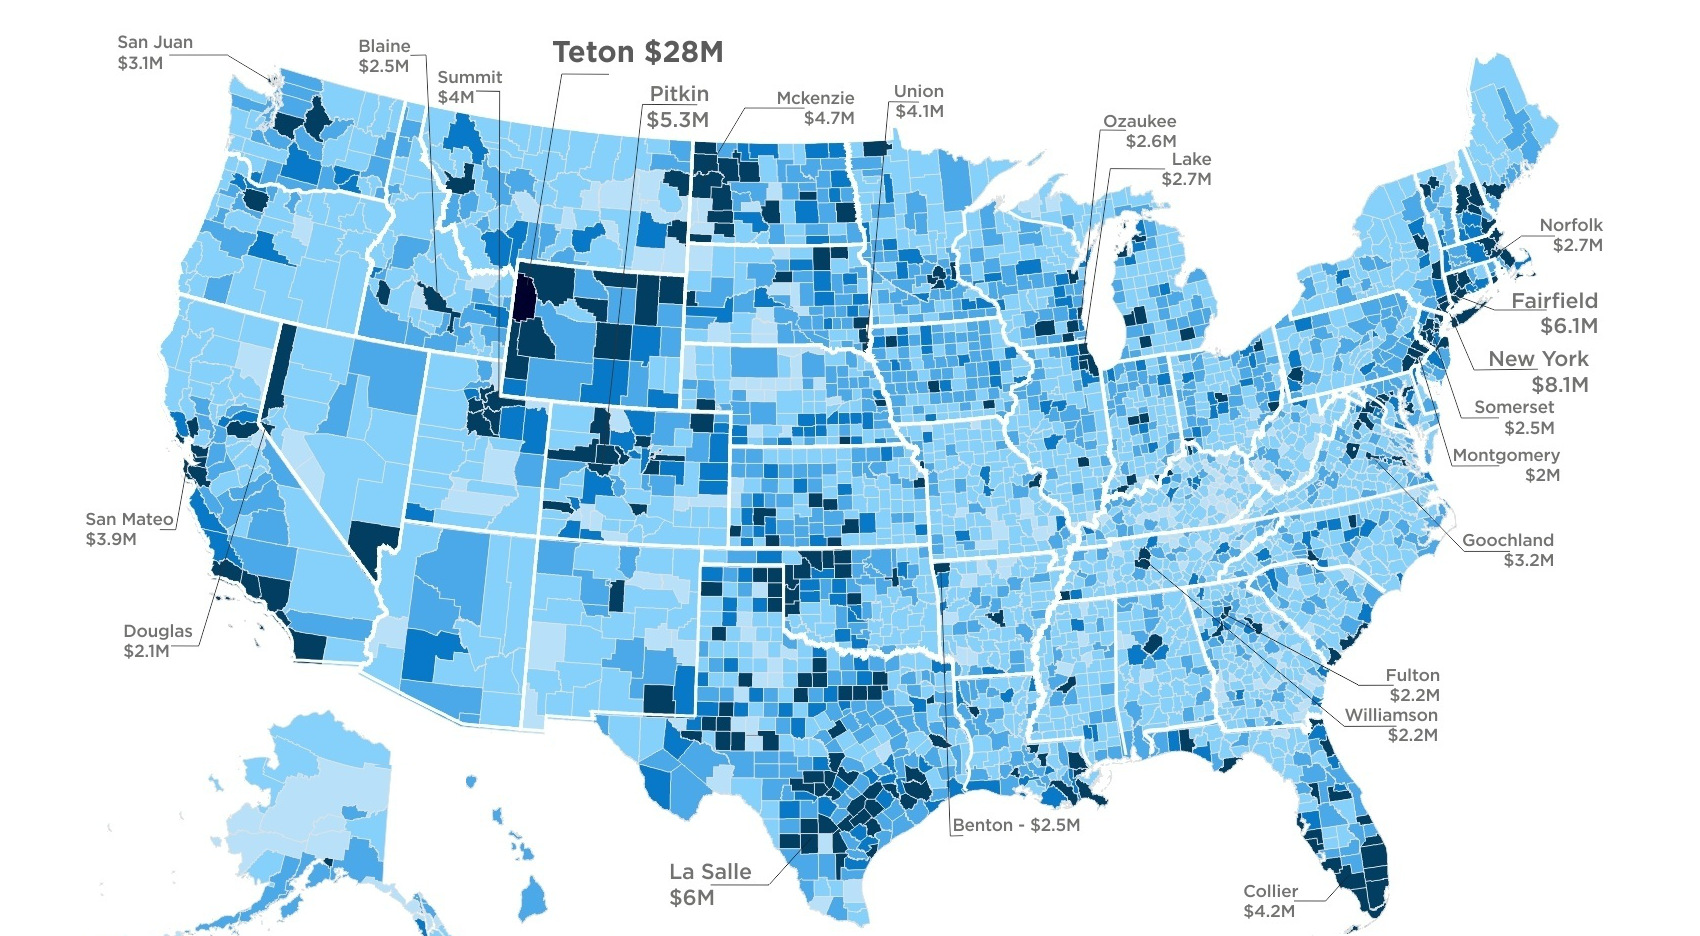
To make it into the Top 1% of US earners, you must make $521k. However, avg income of the 1% varies wildly at a county level,...
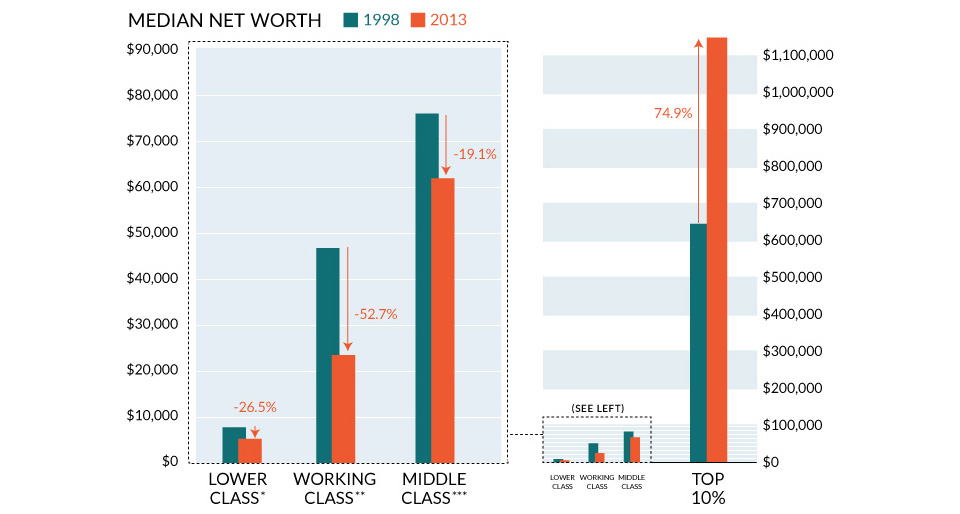
It's clear to many Americans that the 'system' isn't working for most people, and this chart sums up the wealth inequality problem perfectly.
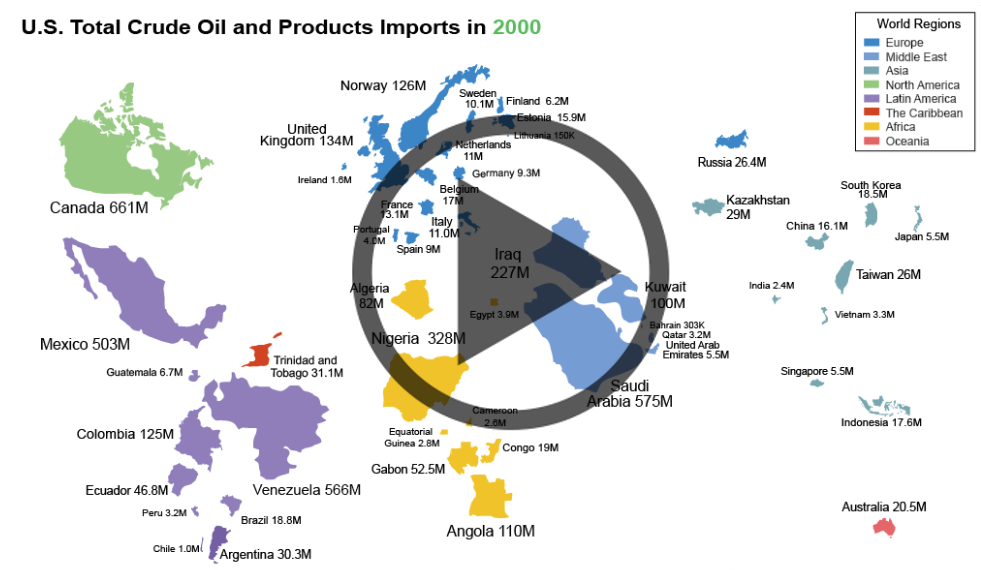
As the United States strives towards energy independence, watch how oil imports have dramatically shifted from the Middle East to a new oil source.
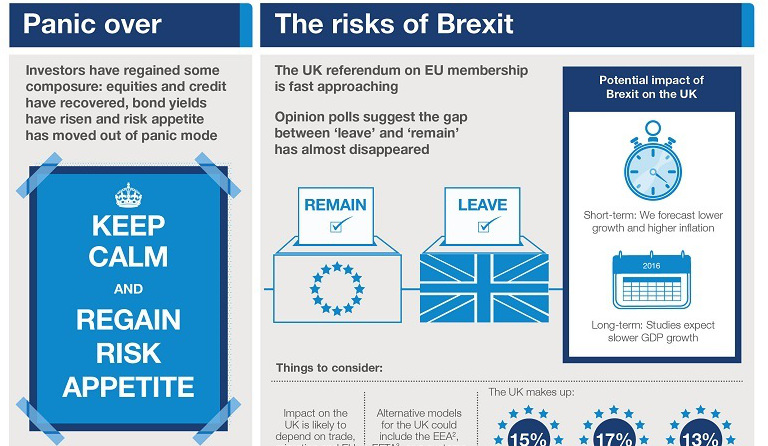
The global economic climate finally has composure, according to asset management firm Schroders. It may be the calm before the storm, though.
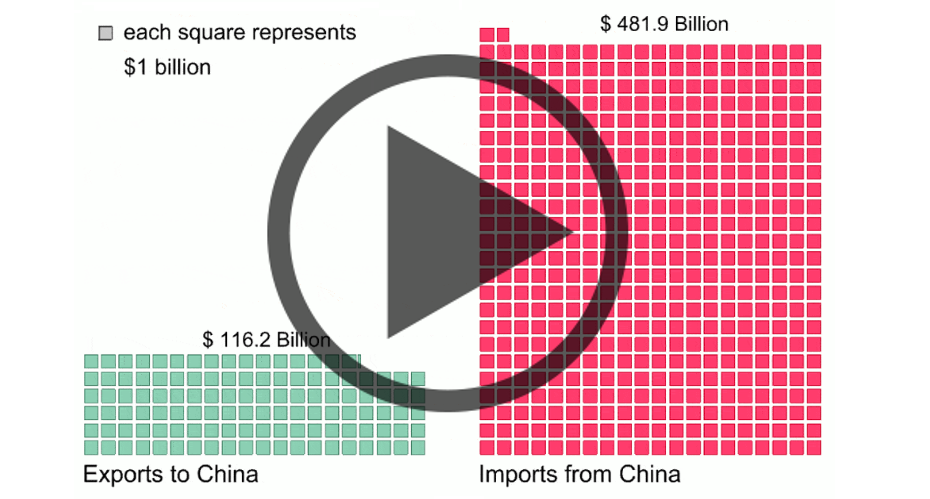
Donald Trump claims that the U.S. keeps losing to China in trade. His numbers are technically untrue, but they're not far off.
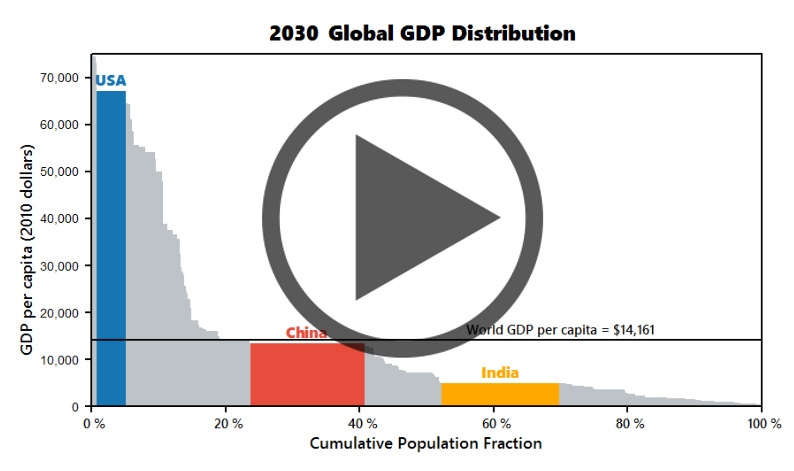
Watch the economies of the United States, China, and India evolve before your eyes from 1970 until 2030 (projected).


