Jobs
The Best U.S. Companies to Work for According to LinkedIn
![]() See this visualization first on the Voronoi app.
See this visualization first on the Voronoi app.
The Best U.S. Companies to Work for According to LinkedIn
This was originally posted on our Voronoi app. Download the app for free on iOS or Android and discover incredible data-driven charts from a variety of trusted sources.
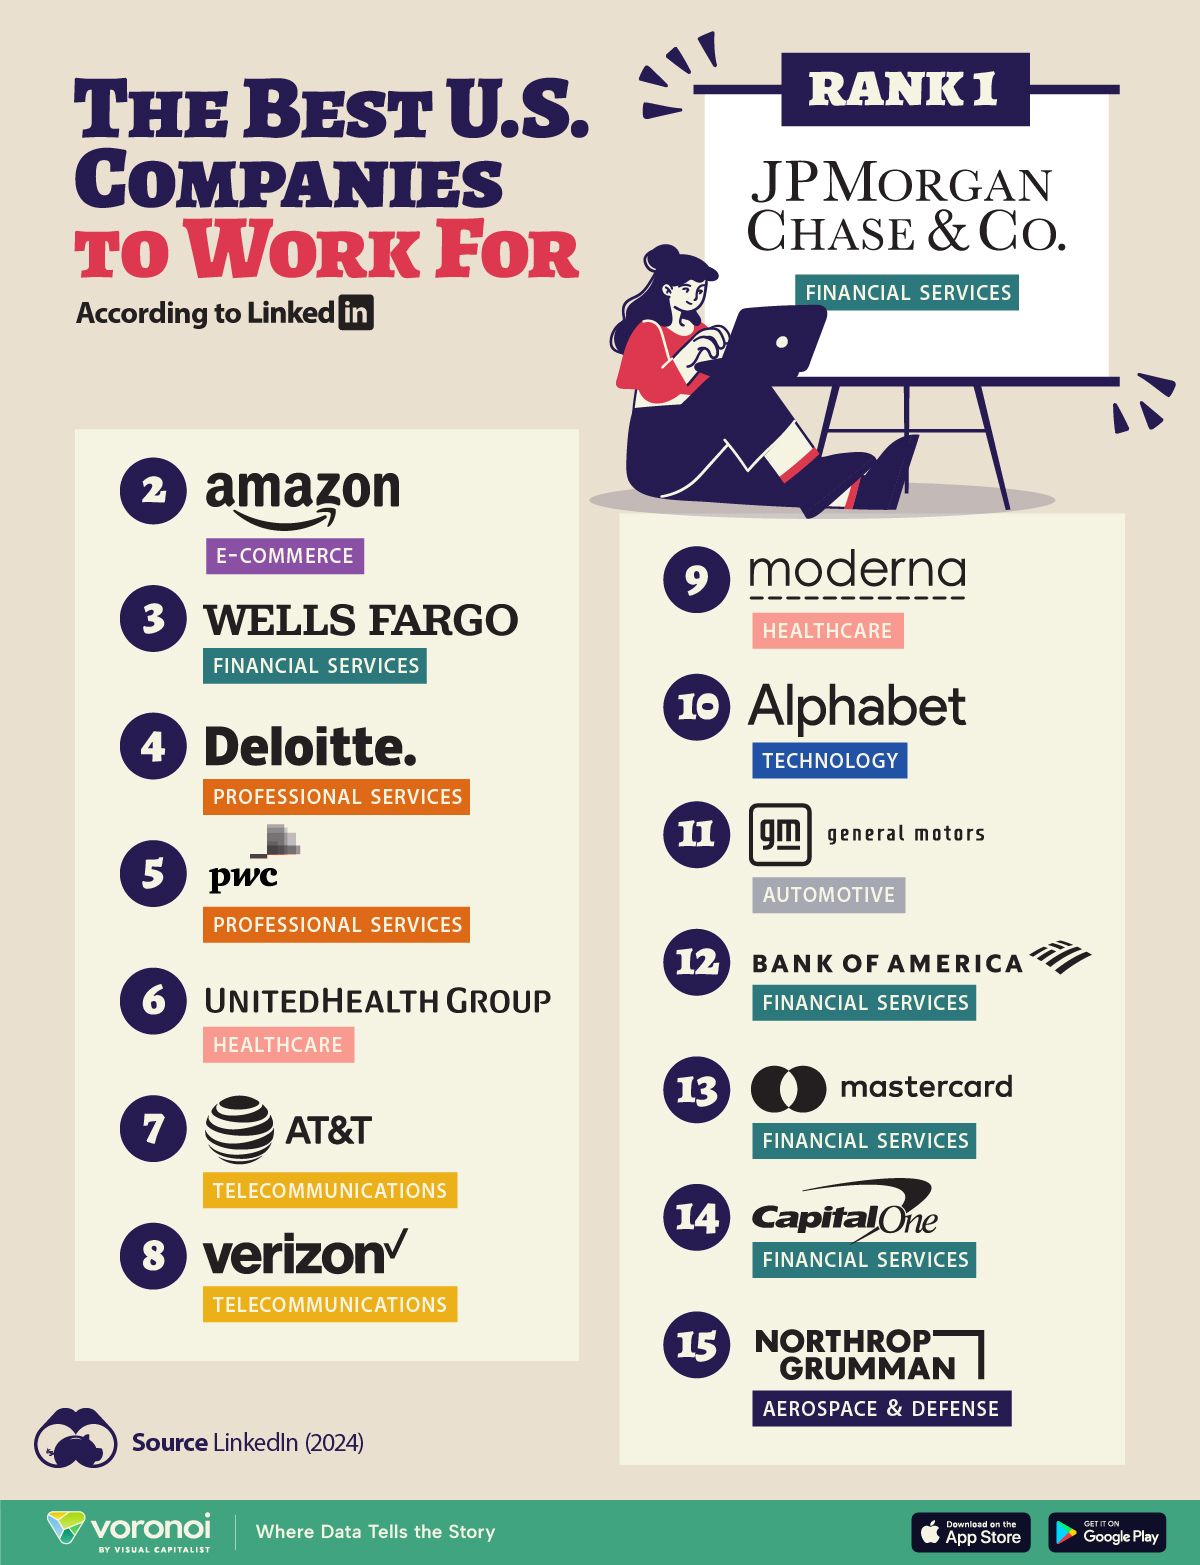
In this graphic, we list the 15 best U.S. companies to work for in 2024, according to LinkedIn data.
LinkedIn ranked companies based on eight pillars: ability to advance, skills growth, company stability, external opportunity, company affinity, gender diversity, educational background, and employee presence in the country.
To be eligible, companies must have had 5,000 or more global employees, with at least 500 in the country as of December 31, 2023.
Data and Highlights
Financial institutions dominate the ranking of the best U.S. companies to work for in 2024, with JP Morgan Chase & Co. ranking first.
| Rank | Company | Industry |
|---|---|---|
| 1 | JP Morgan Chase & Co. | Financial Services |
| 2 | Amazon | E-commerce |
| 3 | Wells Fargo | Financial Services |
| 4 | Deloitte | Professional Services |
| 5 | PwC | Professional Services |
| 6 | UnitedHealth Group | Healthcare |
| 7 | AT&T | Telecommunications |
| 8 | Verizon | Telecommunications |
| 9 | Moderna | Pharmaceuticals |
| 10 | Alphabet Inc. | Technology |
| 11 | General Motors | Automotive |
| 12 | Bank of America | Financial Services |
| 13 | Mastercard | Financial Services |
| 14 | Capital One | Financial Services |
| 15 | Northrop Grumman | Aerospace & Defense |
J.P. Morgan has a program that offers opportunities for candidates without a university degree. In fact, in 2022, 75% of job descriptions at the bank for experienced hires did not require a college degree.
Meanwhile, Deloitte and Amazon offer a variety of free training courses, including in AI.
Moderna includes in its employee package benefits to help avoid employee burnout — from subsidized commuter expenses and pop-up daycare centers, to wellness coaches.
Mastercard offers flexible work availability, with 11.5% remote and 89% hybrid options.
It’s also interesting to note that only Amazon and Alphabet made the cut from the ‘Magnificent Seven’ companies (Apple, Microsoft, Google parent Alphabet, Amazon, Nvidia, Meta Platforms, and Tesla).
See more about the best companies to work for in this infographic, which covers a separate ranking from Glassdoor.


Economy
Mapped: Unemployment Claims by State
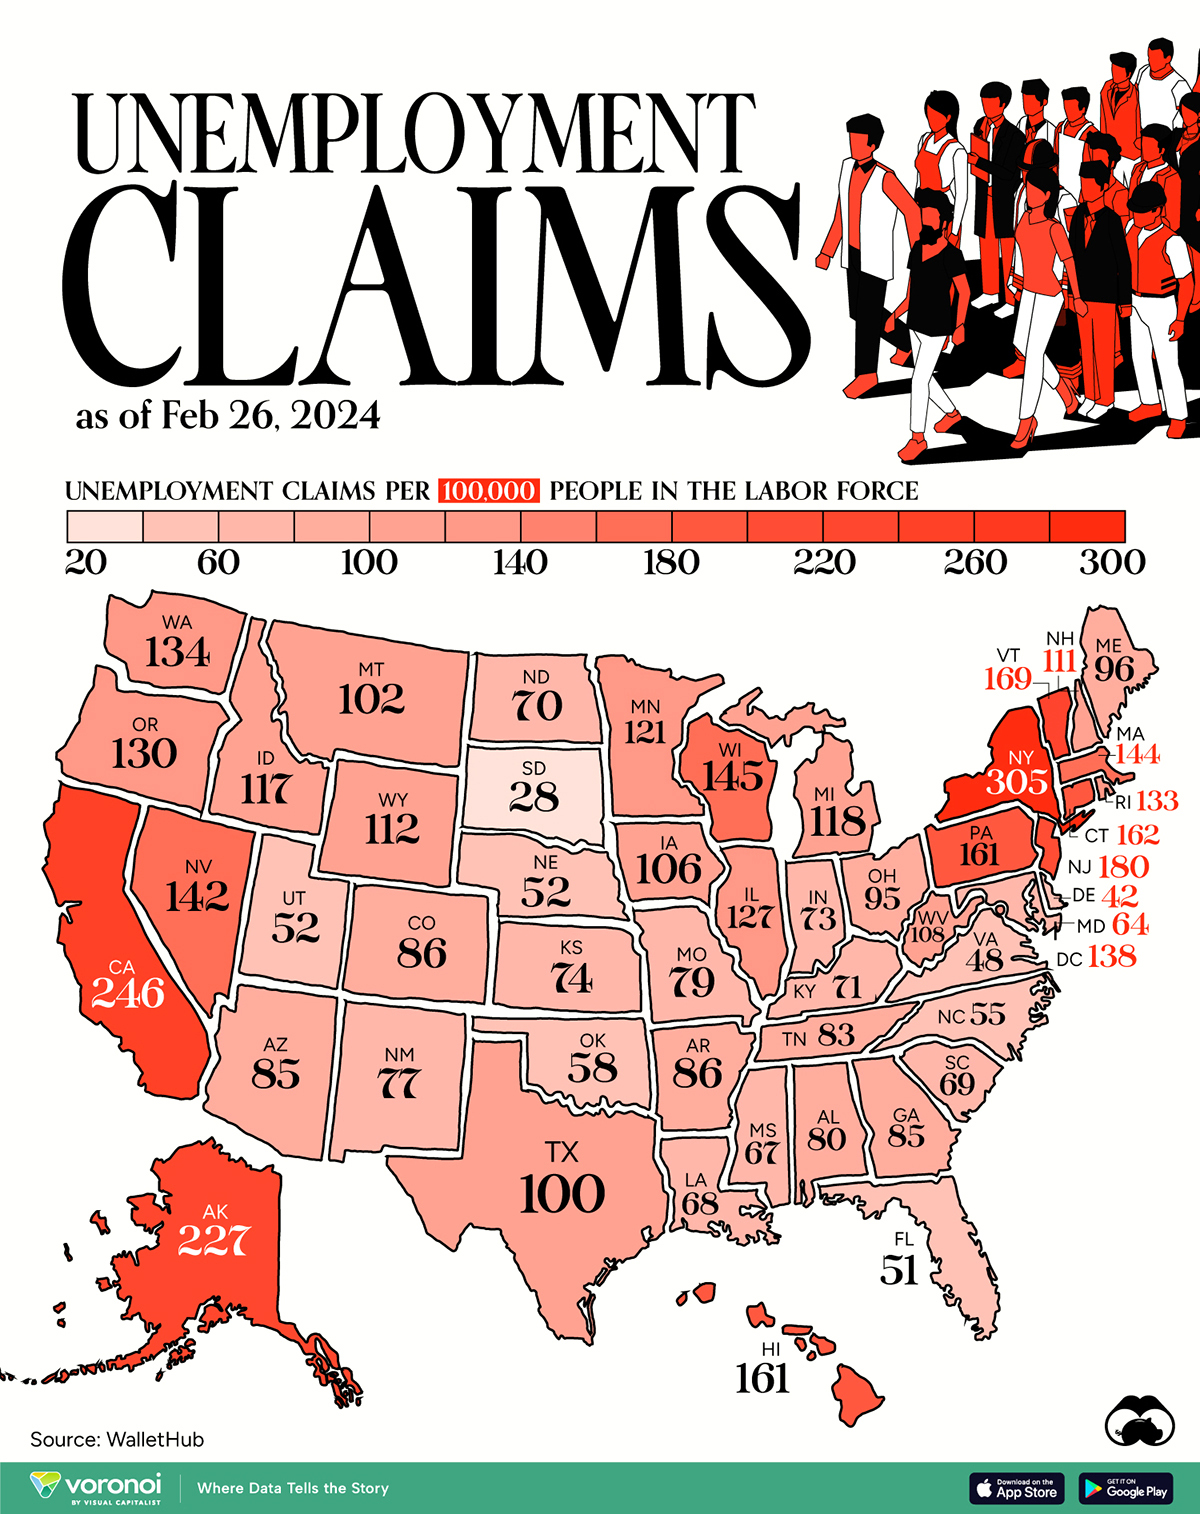
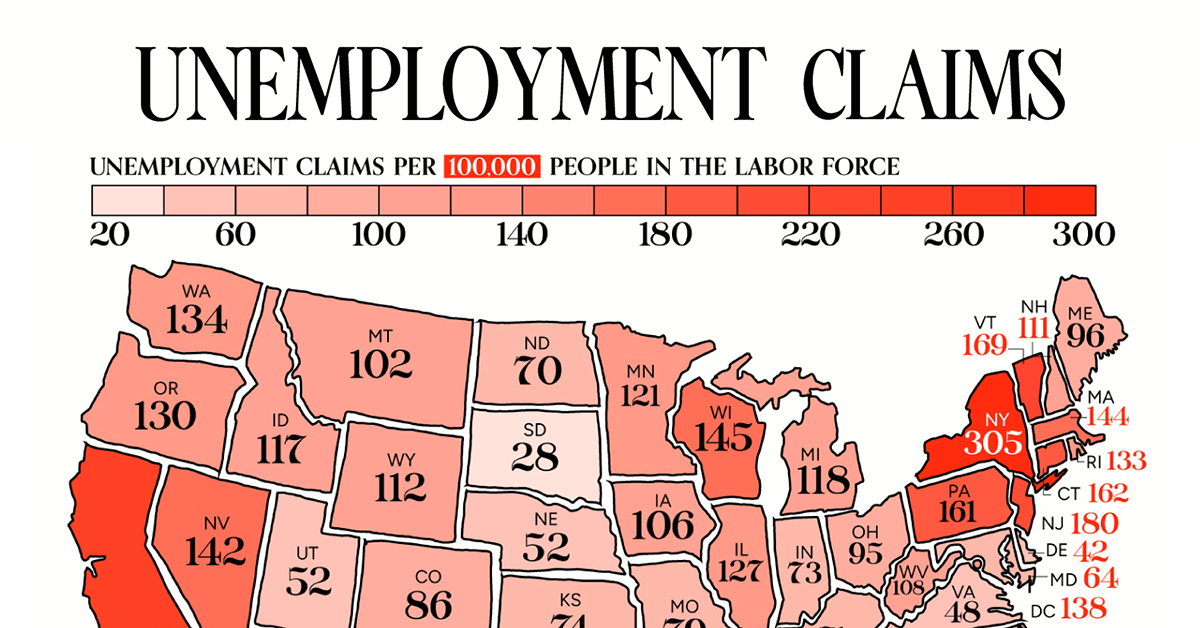
This visual heatmap of unemployment claims by state highlights New York, California, and Alaska leading the country by a wide margin.
Mapped: Weekly Unemployment Claims by State
This was originally posted on our Voronoi app. Download the app for free on iOS or Android and discover incredible data-driven charts from a variety of trusted sources.
Unemployment claims per 100,000 people is a handy metric for gauging the health of the job market. Generally speaking, a higher number of claims suggests that more people are unemployed, which may highlight issues with the economy.
In this graphic, we’ve visualized the number of weekly initial unemployment claims per 100,000 people in the labor force across the U.S., using data from WalletHub. All figures are for the week ending Feb 26, 2024, with data being released in early March.
| State | Unemployment Claims per 100,000 People in the Labor Force |
|---|---|
| New York | 305 |
| California | 246 |
| Alaska | 227 |
| New Jersey | 180 |
| Vermont | 169 |
| Connecticut | 162 |
| Pennsylvania | 161 |
| Hawaii | 161 |
| Wisconsin | 145 |
| Massachusetts | 144 |
| Nevada | 142 |
| DC | 138 |
| Washington | 134 |
| Rhode Island | 133 |
| Oregon | 130 |
| Illinois | 127 |
| Minnesota | 121 |
| Michigan | 118 |
| Idaho | 117 |
| Wyoming | 112 |
| New Hampshire | 111 |
| West Virginia | 108 |
| Iowa | 106 |
| Montana | 102 |
| Texas | 100 |
| Maine | 96 |
| Ohio | 95 |
| Colorado | 86 |
| Arkansas | 86 |
| Arizona | 85 |
| Georgia | 85 |
| Tennessee | 83 |
| Alabama | 80 |
| Missouri | 79 |
| New Mexico | 77 |
| Kansas | 74 |
| Indiana | 73 |
| Kentucky | 71 |
| North Dakota | 70 |
| South Carolina | 69 |
| Louisiana | 68 |
| Mississippi | 67 |
| Maryland | 64 |
| Oklahoma | 58 |
| North Carolina | 55 |
| Nebraska | 52 |
| Utah | 52 |
| Florida | 51 |
| Virginia | 48 |
| Delaware | 42 |
| South Dakota | 28 |
Across the country, there are 6.1 million Americans unemployed as of end of February, resulting in a national unemployment rate of around 3.9%. Notably, this is the highest figure seen since January 2022.
States With the Largest Increases
For further context, we can examine the change in unemployment claims by state for the period of Jan 1- Feb 26, in 2024 and 2023.
States that saw the biggest rise over this period were New York, New Jersey, and Nevada. A top 10 list can be found below.
| State | Change in Unemployment Claims (Jan-Feb, 2023 vs 2024) |
|---|---|
| New York | 2,725% |
| New Jersey | 2,132% |
| Nevada | 505% |
| Arizona | 51% |
| Iowa | 45% |
| Maryland | 35% |
| North Carolina | 34% |
| Virginia | 31% |
| Montana | 25% |
| Oklahoma | 24% |
From a broader perspective, weekly initial claims for unemployment insurance across the U.S. have hovered around the low 200,000s in 2024. This is generally in line with figures seen prior to the COVID-19 pandemic.
In the week of April 4, 2020, unemployment claims spiked to 6.137 million due to COVID-related lockdowns and business closures.
Learn More About the U.S Job Market
Before you go, be sure to check out Visualizing the American Workforce as 100 People to gain a unique perspective on the U.S. economy.

-

 Demographics6 days ago
Mapped: U.S. Immigrants by Region
-

 United States2 weeks ago
Charted: What Southeast Asia Thinks About China & the U.S.
-

 United States2 weeks ago
The Evolution of U.S. Beer Logos
-

 Healthcare1 week ago
What Causes Preventable Child Deaths?
-

 Energy1 week ago
Who’s Building the Most Solar Energy?
-

 Markets1 week ago
Mapped: The Most Valuable Company in Each Southeast Asian Country
-

 Technology1 week ago
Mapped: The Number of AI Startups By Country
-

 Healthcare1 week ago
Life Expectancy by Region (1950-2050F)