Energy
Mapped: The Age of Energy Projects in Interconnection Queues, by State
![]() See this visualization first on the Voronoi app.
See this visualization first on the Voronoi app.

Age of Energy Projects in Interconnection Queues, by State
This was originally posted on our Voronoi app. Download the app for free on iOS or Android and discover incredible data-driven charts from a variety of trusted sources.
By the end of 2023, more than 11,000 energy projects were in interconnection queues in the United States, waiting for a green-light from regional grid operators to proceed with construction.
This map, created in partnership with the National Public Utilities Council, maps out the average age of active energy projects in interconnection queues by state, using data from Berkeley Lab.
Interconnection Queues, Explained
Interconnection queues are lists of energy projects that have made interconnection requests to their regional grid operators. Once submitted, these requests formally initiate the impact study process that each project goes through before grid connection, forming waiting lists for approval known as interconnection queues.
In recent years, both the number and generation capacity of queued projects have surged in the United States, along with the length of time spent in queue.
According to Berkeley Lab, the amount of generation capacity entering queues each year has risen by more than 550% from 2015 to 2023, with average queue duration rising from 3 years to 5 years the same period.
As a result of the growing backlog, a large proportion of projects ultimately withdraw from queues, leading to only 19% of applications reaching commercial operations.
The Backlog: Number of Projects and Average Wait Times
Of the 11,000 active projects in U.S. queues at the end of 2023, Texas, California, and Virginia had the most in queue; 1,208, 947, and 743, respectively.
When looking at the average ages of these projects, all three states hovered around the national average of 34 months (2.83 years), with Texas sporting 28 months, California 33, and Virginia 34.
Vermont, Minnesota, Wisconsin, and Florida, on the other hand, had the highest average queue durations; 54, 49, 47, and 46 months, respectively.
Average Queue Duration by Project Type
At the end of 2023, more than 95% of the generation capacity in active interconnection queues was for emission-free resources. The table below provides a breakdown.
| Project Type | Average Queue Duration (As of 12/31/2023) | Number of Projects in Queue |
|---|---|---|
| Wind | 40 months | 841 |
| Solar | 34 months | 4,506 |
| Wind+Battery | 34 months | 76 |
| Solar+Battery | 27 months | 2,377 |
| Battery | 24 months | 2,818 |
Wind projects had the highest wait times at the end of 2023 with an average age of 40 months (3.33 years). Solar projects, on the other hand, made up more than 40% of projects in queue.
Overall, reducing the time that these renewable energy projects spend in queues can accelerate the transition to a low-carbon energy future.
According to the U.S. Department of Energy, enhancing data transparency, streamlining approval processes, promoting economic efficiency, and maintaining a reliable grid are some of the ways this growing backlog can be mitigated.


Energy
Visualized: A Decade of Clean Energy Investment
In this graphic, Visual Capitalist has partnered with EnergyX to explore the growth of global clean energy investment.
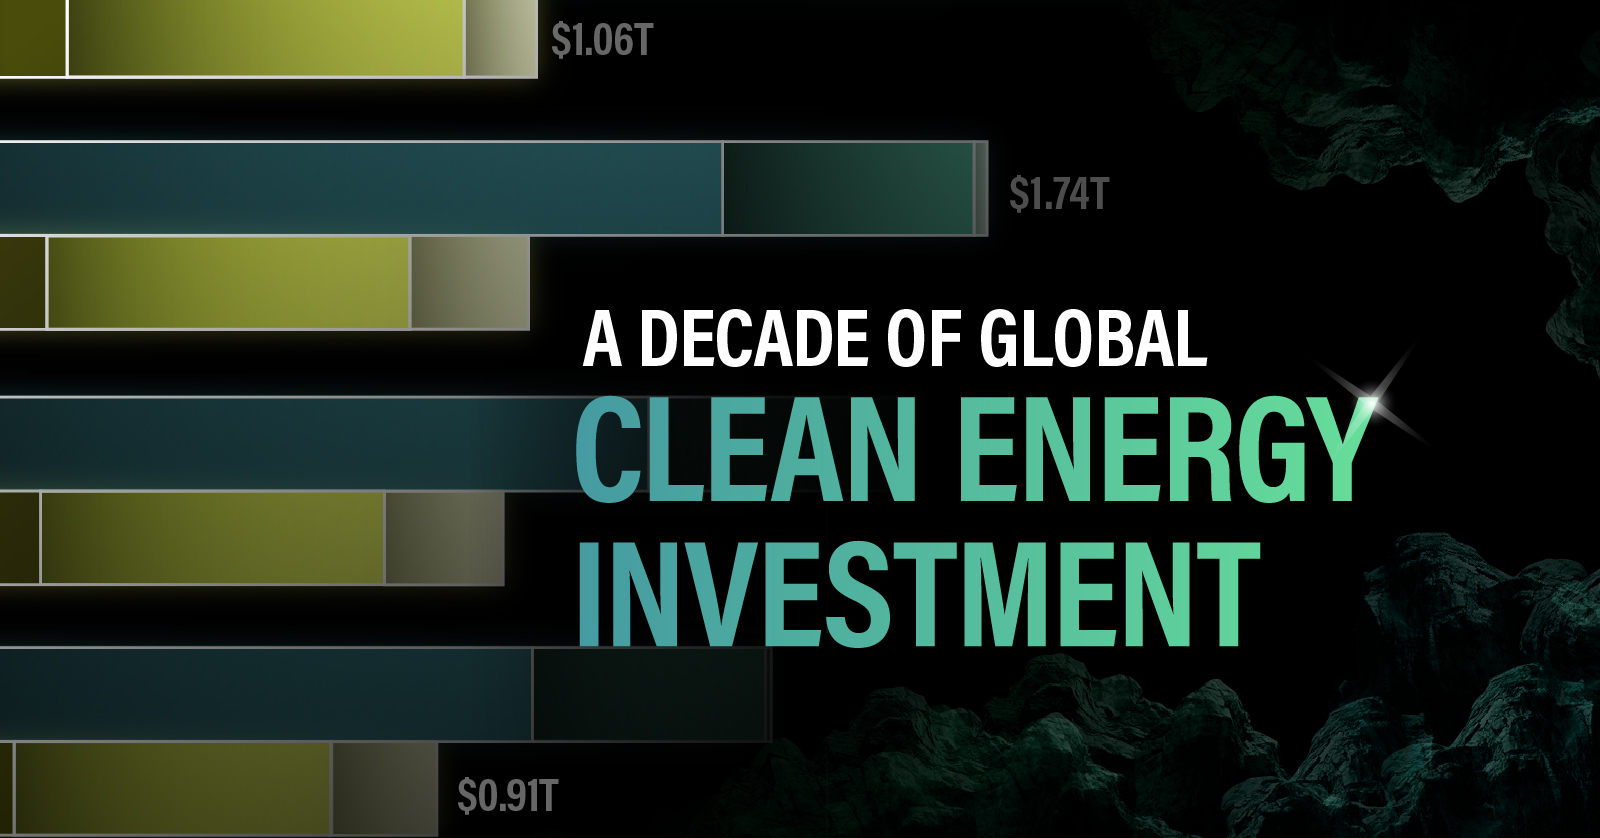
Visualized: A Decade of Clean Energy Investment
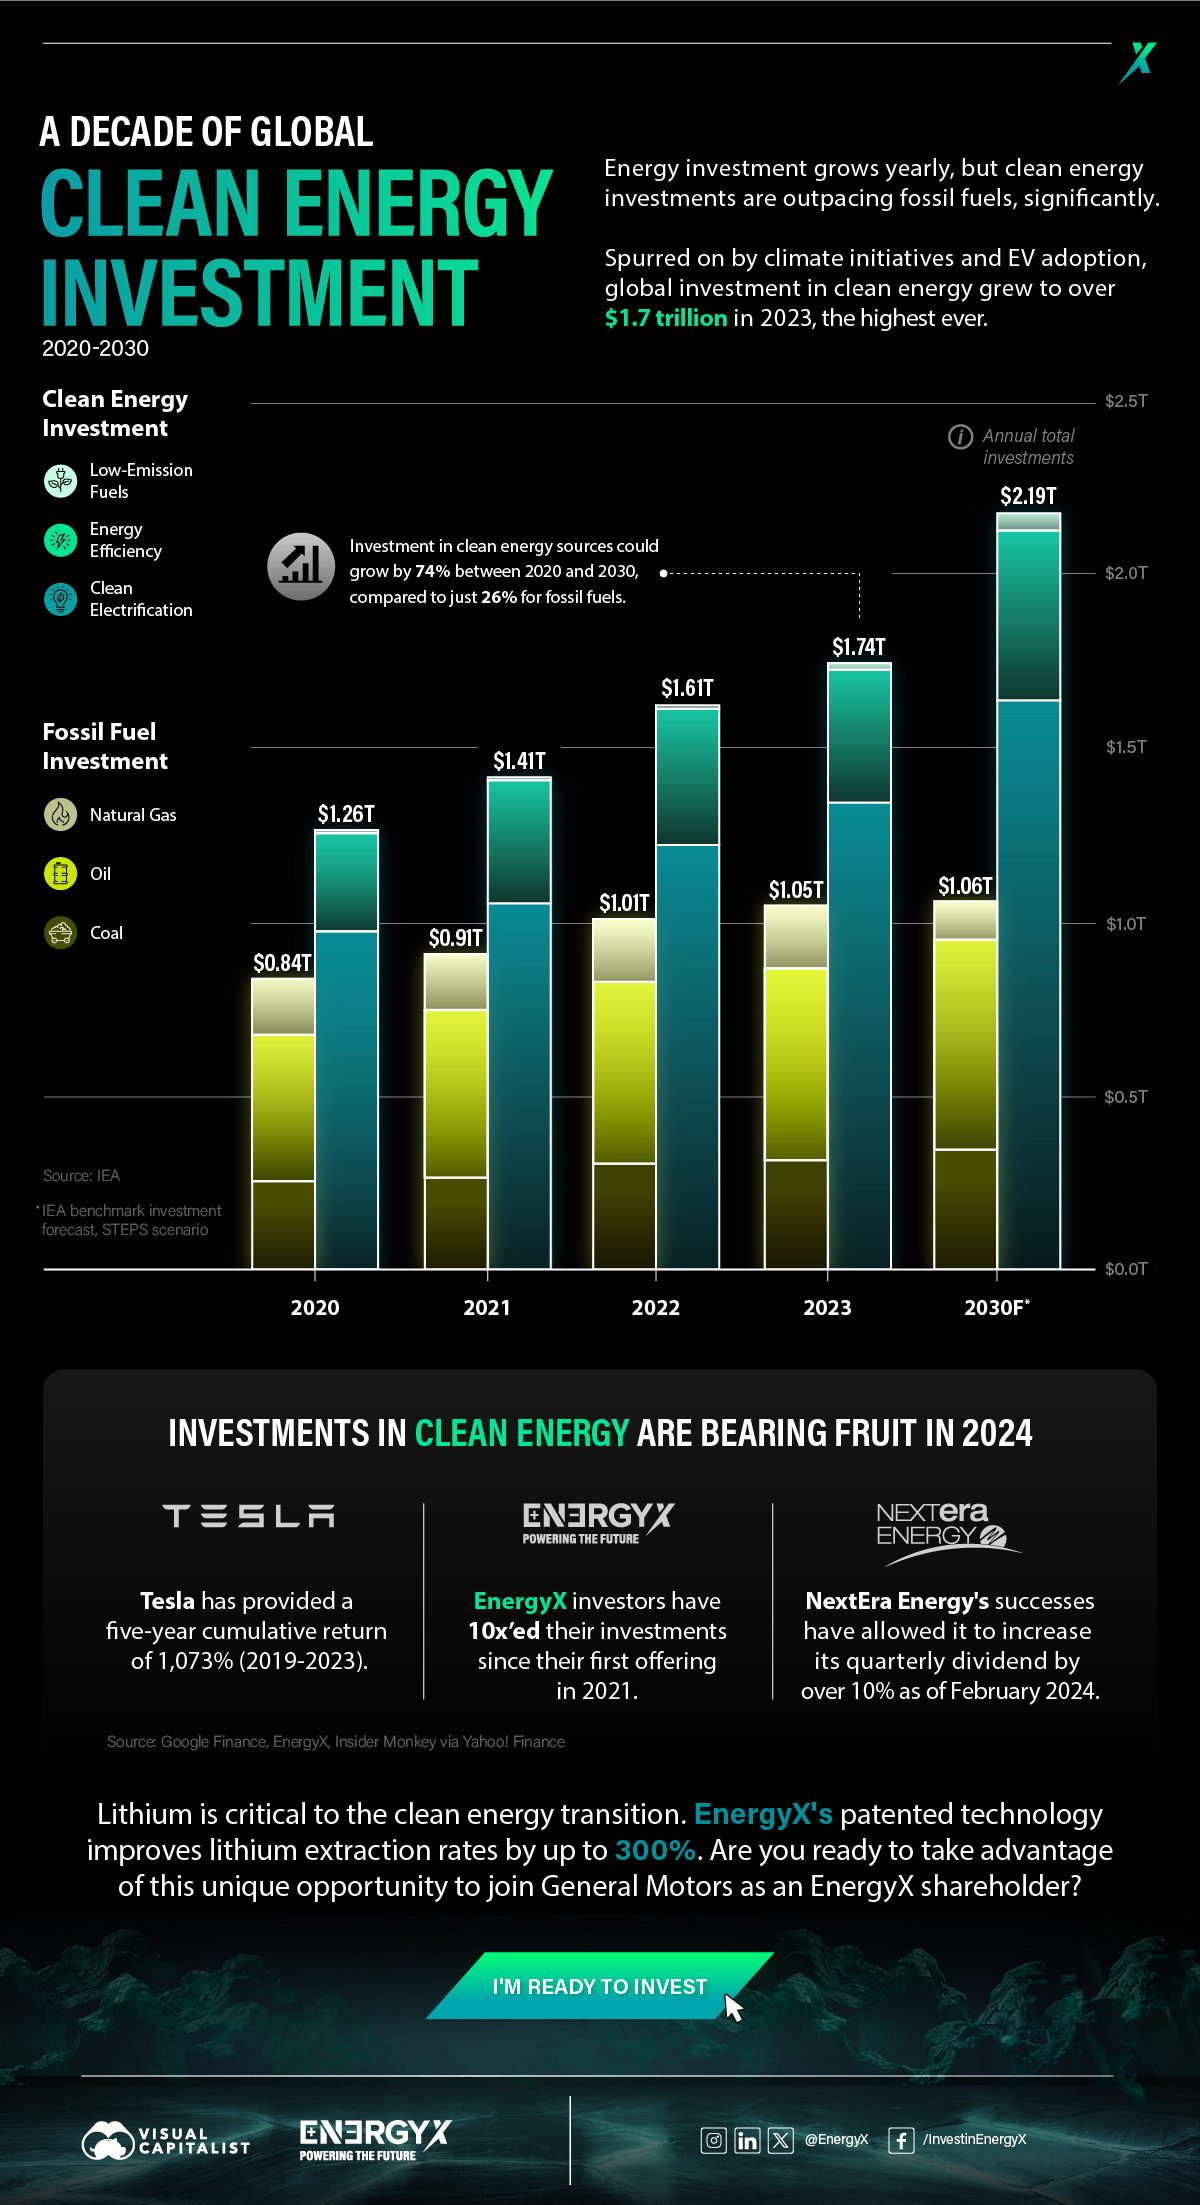
Global energy investment is growing every year. But recently, investments in clean energy have been significantly outpacing investments in fossil fuels.
For this graphic, we partnered with EnergyX to explore how global energy investment has changed and learn how investments in clean energy are starting to pay off for their investors.
The Rise of Sustainable Energy Investment
Propelled by various climate initiatives such as the Paris Agreement and the widespread adoption of EVs, global investment in sustainable energy surged to over $1.7 trillion in 2023, the highest ever, and the IEA projects that this growth could continue:
| Energy Product | 2020 | 2021 | 2022 | 2023 | 2030F |
|---|---|---|---|---|---|
| Clean Electrification | $0.97T | $1.05 | $1.21T | $1.34T | $1.65T |
| Low-Emission Fuels | $0.01T | $0.01 | $0.01T | $0.02T | $0.05T |
| Energy Efficiency | $0.28T | $0.35 | $0.39T | $0.38T | $0.49T |
| Clean Energy Total | $1.26T | $1.41T | $1.61T | $1.74T | $2.19T |
| Natural Gas | $0.26T | $0.27T | $0.31T | $0.32T | $0.35T |
| Oil | $0.42T | $0.48T | $0.52T | $0.55T | $0.60T |
| Coal | $0.16T | $0.16T | $0.18T | $0.18T | $0.11T |
| Fossil Fuel Total | $0.84T | $0.91T | $1.01T | $1.05T | $1.06T |
| Total Energy Investment | $2.10T | $2.32T | $2.62T | $2.79T | $3.25T |

Between 2020 and 2030, global investment in sustainable energy could increase by 74% to nearly $2.2 trillion, compared to just 26% additional investment in fossil fuels, with a forecast total of $1.06 trillion. This shows that sustainability is the future of energy investment.
Sustainable Investor Success Stories
While the growing investments in clean energy show that the world embraces sustainability, energy investors will still look for decent returns. Now, in 2024, clean energy investments are beginning to bear fruit. Here are just a few examples:
- Between 2019 and 2023, Tesla had a cumulative return of 1,073%
- NextEra Energy’s quarterly dividend increased by over 10% as of February 2024
- Investors in EnergyX have 10x’ed their investments since the company’s first offering in 2021
Lithium plays a critical role in powering electric vehicles (EVs) and facilitating the transition to sustainable energy. EnergyX has patented technology that enhances lithium extraction rates by up to 300%, contributing to meeting the growing demand for lithium and fueling the EVs of the future.


-

 Energy2 weeks ago
Who’s Building the Most Solar Energy?
China’s solar capacity triples USA, nearly doubles EU.
-

 Energy3 weeks ago
Mapped: The Age of Energy Projects in Interconnection Queues, by State
This map shows how many energy projects are in interconnection queues by state and how long these projects have been queued up, on average.
-

 Lithium4 weeks ago
Ranked: The Top 10 EV Battery Manufacturers in 2023
Asia dominates this ranking of the world’s largest EV battery manufacturers in 2023.
-

 Energy1 month ago
The World’s Biggest Nuclear Energy Producers
China has grown its nuclear capacity over the last decade, now ranking second on the list of top nuclear energy producers.
-

 Energy2 months ago
The World’s Biggest Oil Producers in 2023
Just three countries accounted for 40% of global oil production last year.
-

 Energy2 months ago
How Much Does the U.S. Depend on Russian Uranium?
Currently, Russia is the largest foreign supplier of nuclear power fuel to the U.S.
-

 Public Opinion2 weeks ago
Charted: How Americans Feel About Federal Government Agencies
-

 Mining1 week ago
The Biggest Salt Producing Countries in 2023
-

 Misc1 week ago
Visualizing Global Losses from Financial Scams
-

 population1 week ago
Mapped: U.S. States By Number of Cities Over 250,000 Residents
-

 Business1 week ago
Charted: How the Logos of Select Fashion Brands Have Evolved
-

 United States1 week ago
Mapped: Countries Where Recreational Cannabis is Legal
-

 War1 week ago
Visualized: Aircraft Carriers by Country
-

 Culture2 weeks ago
How Popular Snack Brand Logos Have Changed