

In this graphic, we explore the projected generation capacity of different clean electricity technologies in the U.S. for 2023 and 2024.


In this streamgraph, we break down global CO2 emissions between 1950 and 2022 using data from Berkeley Earth and Global Carbon Project.
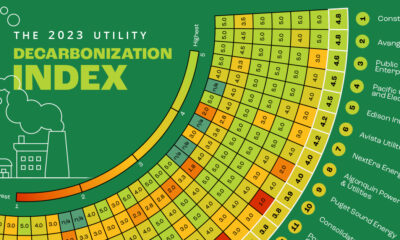

Here's a preview of the 2023 Utility Decarbonization Index, which tracks the decarbonization progress of the largest U.S. utilities.


A look at the flow of energy-related CO2 emissions from the sources that generate energy to the sectors that use it.
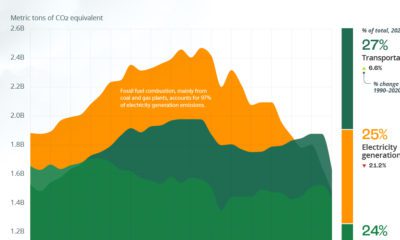

The U.S. emits about 6 billion metric tons of greenhouse gases a year. Here's how these emissions rank by sector.
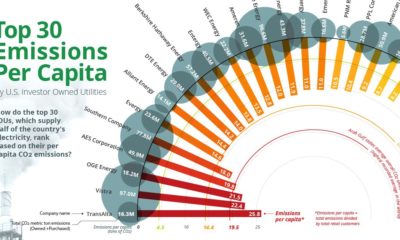

Roughly 25% of all GHG emissions come from electricity production. See how the top 30 IOUs rank by emissions per capita.


