Environment
Visualizing the Flow of Energy-Related CO2 Emissions in the U.S.
Subscribe to the Decarbonization Channel’s free mailing list for more like this
Visualizing the Flow of Energy-Related CO2 Emissions in the U.S.
This was originally posted on the Decarbonization Channel. Subscribe to the free mailing list to be the first to see graphics related to decarbonization with a focus on the U.S. energy sector.
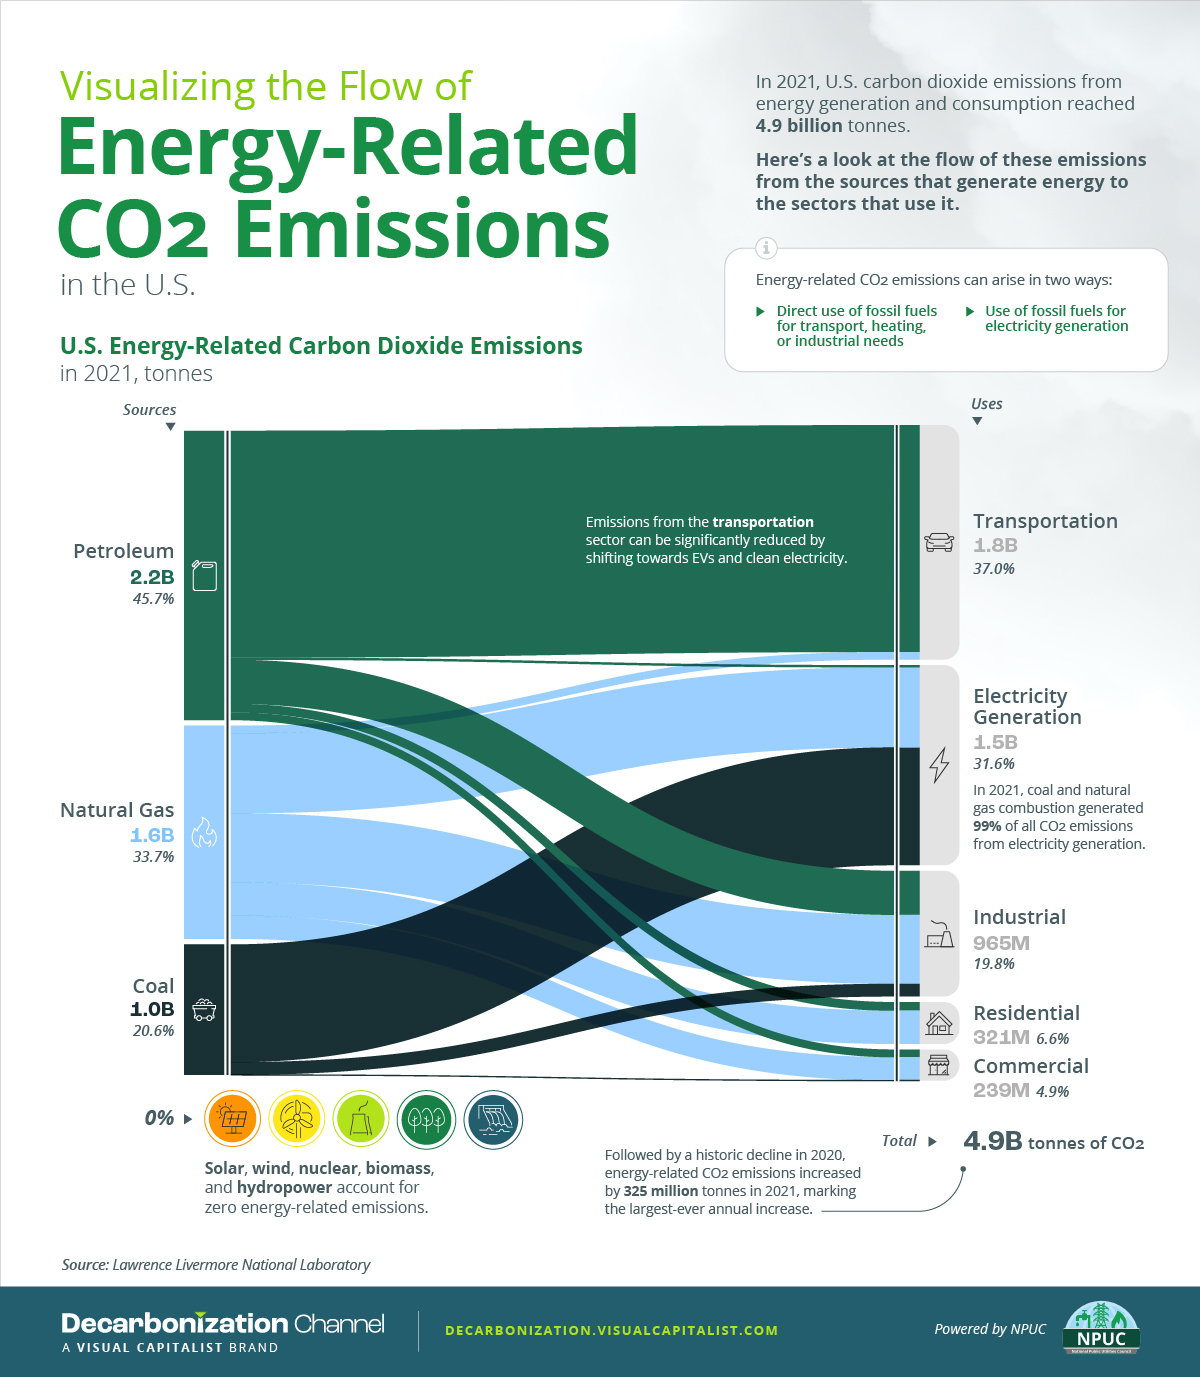
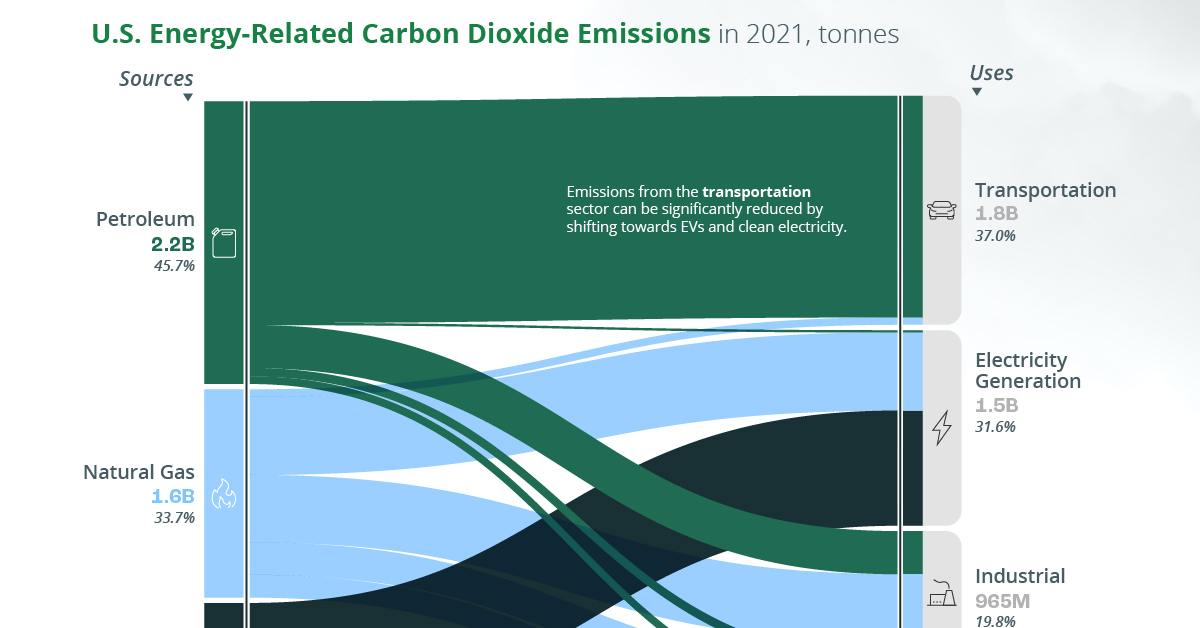
In 2021, U.S. carbon dioxide emissions from the generation and consumption of energy reached 4.9 billion tonnes.
To better understand how various energy sources and their end-uses contribute to carbon emissions, this graphic visualizes the flow of energy-related CO2 emissions in the U.S. using carbon flow charts by the Lawrence Livermore National Laboratory.
What are Energy-Related CO2 Emissions?
Energy-related CO2 emissions refer to the release of carbon dioxide as a result of the combustion of fuels to produce energy. They arise through the direct use of fossil fuels for transport, heating, or industrial needs, as well as the use of fossil fuels for electricity generation.
To provide some context, non-energy-related CO2 emissions are those that result from industrial chemical reactions, deforestation, and agricultural activities.
As the largest contributor to carbon emissions, however, energy-related CO2 emissions account for approximately 85% of all emissions in the U.S. which we will now explore in more detail.
U.S. Energy-Related CO2 Emissions in 2021
Followed by a pandemic-driven decline in 2020, energy-related carbon dioxide emissions in the U.S. increased by 325 million tonnes in 2021, marking the largest-ever annual increase.
| Energy Source | CO2 emissions in million tonnes, 2021 | % of total energy-related emissions |
|---|---|---|
| Petroleum | 2,223 | 45.7% |
| Natural Gas | 1,637 | 33.7% |
| Coal | 1,003 | 20.6% |
| Solar, Wind, Nuclear, Hydro, and Biomass | 0 | 0% |
| Total | 4,863 | 100% |
When we follow the CO2 emissions from the above fossil fuels to their end uses, transportation and electricity generation stand out as the biggest contributors.
In 2021, these two sectors accounted for more than 68% of all energy-related emissions in the country, roughly emitting 3.3 billion tonnes of CO2.
| End-Uses | CO2 emissions in million tonnes, 2021 | % of total energy-related emissions |
|---|---|---|
| Transportation | 1,801 | 37.0% |
| Electricity Generation | 1,537 | 31.6% |
| Industrial Uses | 965 | 19.8% |
| Residential Uses | 321 | 6.6% |
| Commercial Uses | 239 | 4.9% |
| Total | 4,863 | 100% |
When it comes to transportation, petroleum accounted for 97% of emissions, largely due to motor gasoline and diesel consumption. On the other hand, coal and natural gas made up 99% of CO2 emissions related to electricity generation.
Due to its high carbon intensity, coal’s contribution to power sector emissions may also be of particular interest. As the share of coal rose from 20% to 23% in the U.S. electricity mix in 2021, electricity emissions from coal also increased for the first time since 2014.
Naturally, this shift raised the overall energy-related CO2 emissions in 2021. It also caused a 4% hike in the carbon intensity of the country’s electricity.
Lowering Emissions
To avoid the impacts of climate change, many countries and companies are working towards decarbonization across all sectors, which can largely be facilitated by reductions in energy-related carbon emissions.
Accounting for nearly 70% of all energy-related CO2 emissions, transportation and utilities can be important pillars in these efforts.


Green
Top Countries By Forest Growth Since 2001
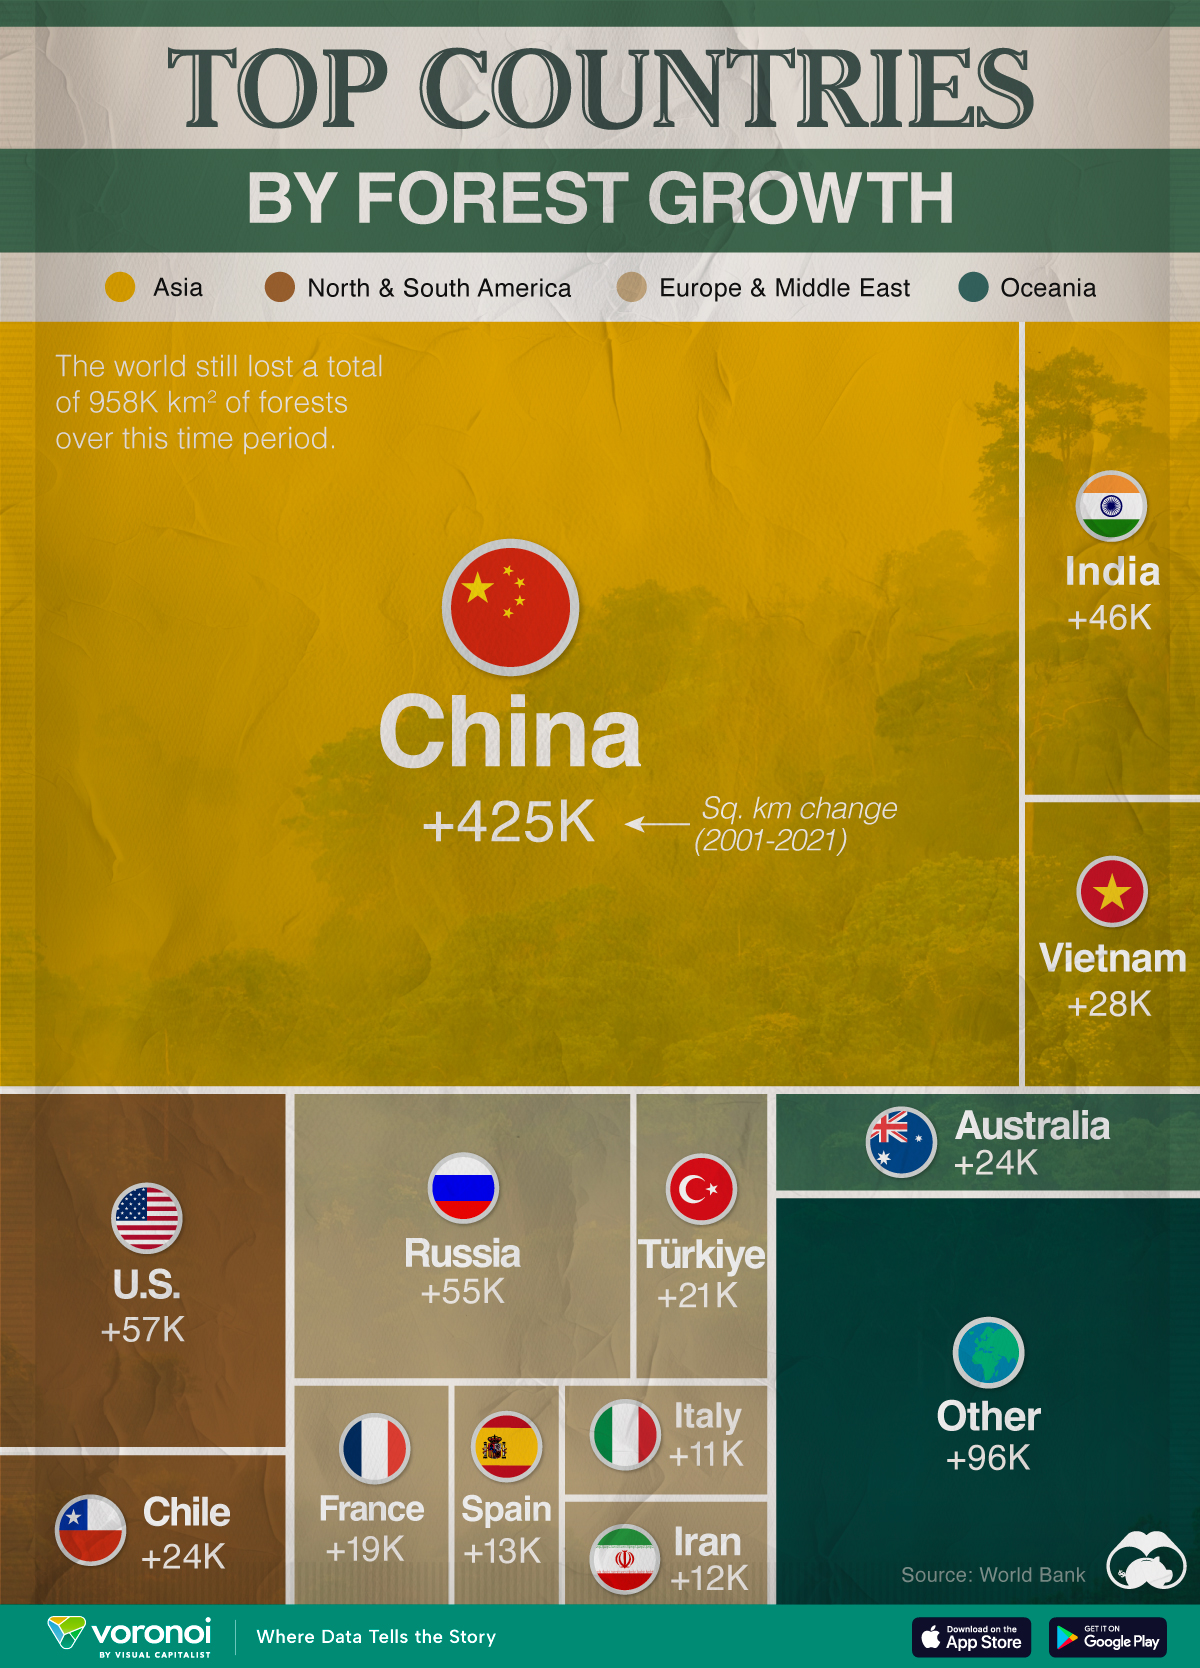
One country is taking reforestation very seriously, registering more than 400,000 square km of forest growth in two decades.

Ranked: Top Countries By Forest Growth Since 2001
This was originally posted on our Voronoi app. Download the app for free on Apple or Android and discover incredible data-driven charts from a variety of trusted sources.
Reforestation is tricky business: it’s expensive, difficult to plan, and even harder to execute. And this is without all the associated environmental obstacles: weather, pests, and natural calamities.
However, some countries have prioritized replanting their lost forests, especially in the last two decades as the climate movement has gathered steam.
We visualized forest growth around the world, ranking countries by their forest area increases between 2001–2021, measured in square kilometers (km²).
All of this data was sourced from the World Bank. Note that countries are ranked by forest growth in square kilometers, rather than percentage change.
Which Country Leads Forest Growth Since 2001?
China tops the list, expanding its forest area by nearly 425,000 km2 (roughly the size of Sweden) between 2001–21. This is more than the next 19 countries combined. Relatively speaking, China’s forests increased by almost one-fourth.
| Rank | Country | Region | 2001–21 Change (Km2) | % of Forest Growth |
|---|---|---|---|---|
| 1 | 🇨🇳 China | Asia | 424,962 | 24% |
| 2 | 🇺🇸 U.S. | North America | 57,406 | 2% |
| 3 | 🇷🇺 Russia | Europe | 54,564 | 1% |
| 4 | 🇮🇳 India | Asia | 46,449 | 7% |
| 5 | 🇻🇳 Vietnam | Asia | 27,745 | 23% |
| 6 | 🇨🇱 Chile | South America | 24,257 | 15% |
| 7 | 🇦🇺 Australia | Oceania | 24,178 | 2% |
| 8 | 🇹🇷 Turkiye | Middle East | 21,345 | 11% |
| 9 | 🇫🇷 France | Europe | 19,353 | 13% |
| 10 | 🇪🇸 Spain | Europe | 13,374 | 8% |
| 11 | 🇮🇷 Iran | Middle East | 13,033 | 14% |
| 12 | 🇮🇹 Italy | Europe | 11,848 | 14% |
| 13 | 🇨🇺 Cuba | Central America | 7,573 | 30% |
| 14 | 🇹🇭 Thailand | Asia | 7,315 | 4% |
| 15 | 🇺🇿 Uzbekistan | Asia | 7,152 | 24% |
| 16 | 🇺🇾 Uruguay | South America | 6,468 | 46% |
| 17 | 🇷🇴 Romania | Europe | 5,482 | 9% |
| 18 | 🇧🇬 Bulgaria | Europe | 4,948 | 15% |
| 19 | 🇧🇾 Belarus | Europe | 4,734 | 6% |
| 20 | 🇵🇱 Poland | Europe | 4,090 | 5% |
| N/A | 🌍 World | -957,658 | -2% |
There are some other countries who have achieved similar relative levels of reforestation. Within Asia, Vietnam’s forests as a percentage of total land area have doubled since 1990. Since 2001, its forests have grown nearly 28,000 km², a 23% increase.
Uzbekistan similarly expanded its forested area by 24%, which amounts to about 7,000 km².
Meanwhile, Chile and Uruguay, are the only two South American countries that have managed to expand their forest cover in the last two decades—the latter by a staggering 46%. In contrast, the rest of South America is instead seeing significant deforestation.
It’s interesting to note that reforestation also comes with its own risks. Introducing non-native or monoculture tree species can reduce biodiversity and lead to soil erosion.
And despite global reforestation efforts, the world still lost close to a million square kilometers of forests since 2001.
-

 Debt1 week ago
How Debt-to-GDP Ratios Have Changed Since 2000
-

 Markets2 weeks ago
Ranked: The World’s Top Flight Routes, by Revenue
-

 Countries2 weeks ago
Population Projections: The World’s 6 Largest Countries in 2075
-

 Markets2 weeks ago
The Top 10 States by Real GDP Growth in 2023
-

 Demographics2 weeks ago
The Smallest Gender Wage Gaps in OECD Countries
-

 United States2 weeks ago
Where U.S. Inflation Hit the Hardest in March 2024
-

 Green2 weeks ago
Top Countries By Forest Growth Since 2001
-

 United States2 weeks ago
Ranked: The Largest U.S. Corporations by Number of Employees