Green
Chart: Automakers’ Adoption of Fuel-Saving Technologies
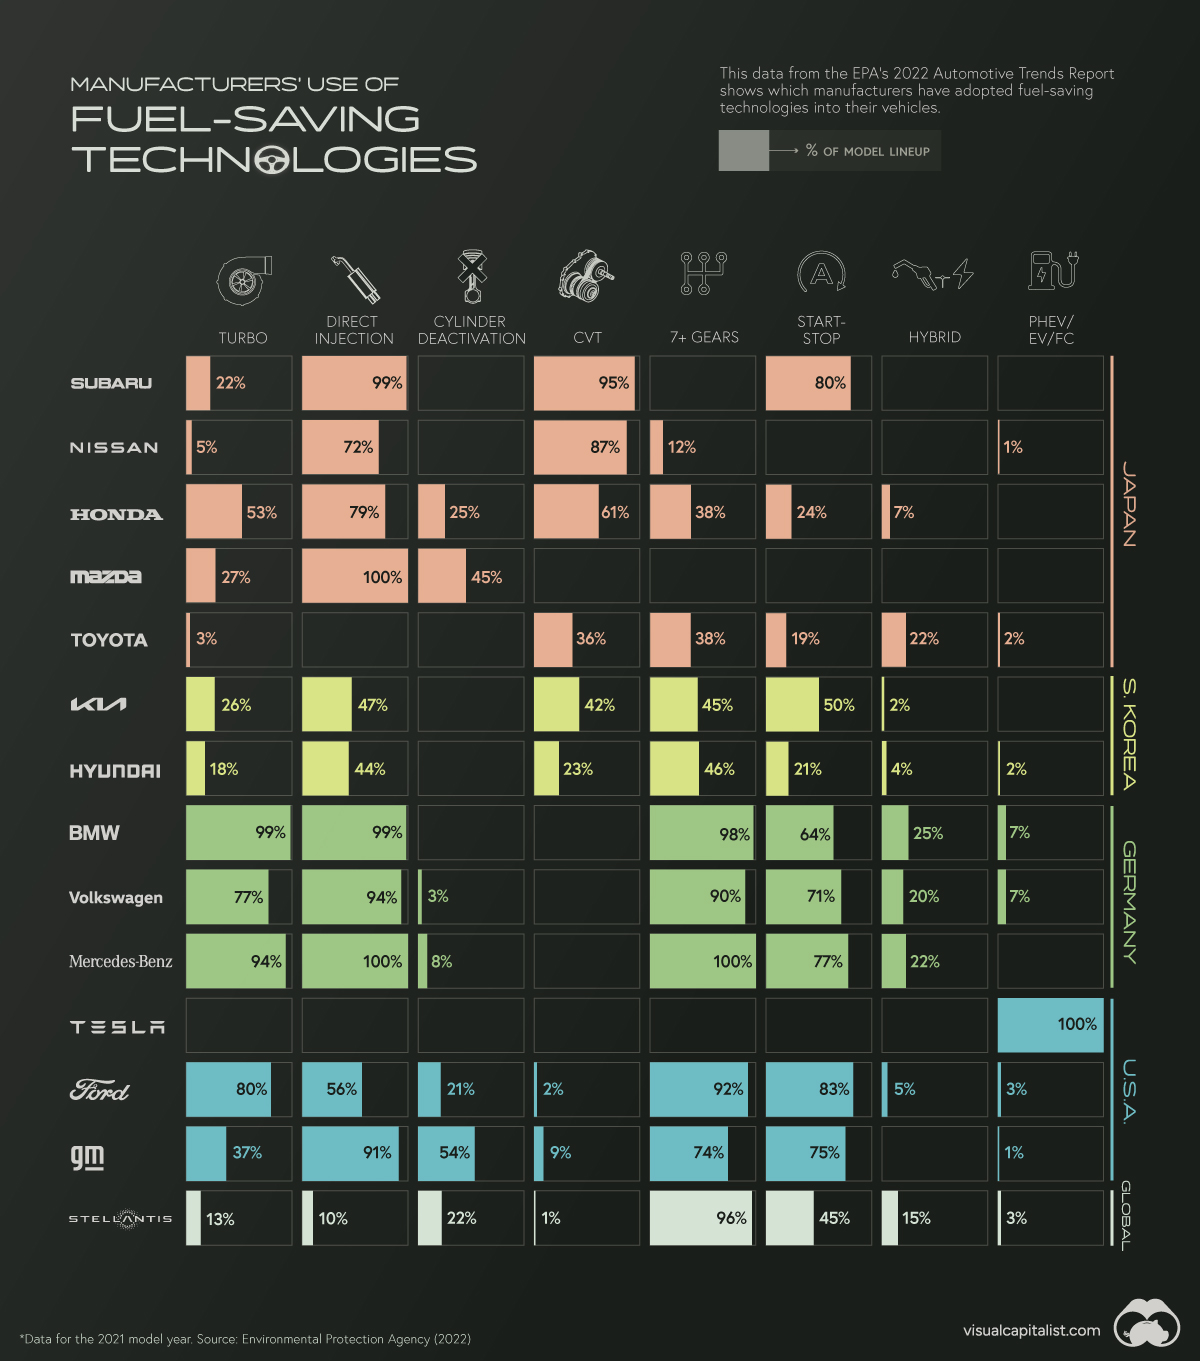


Automakers’ Adoption of Fuel-Saving Technologies
Over the past few decades, automakers have invested plenty of time and money into various fuel-saving technologies. This includes innovations such as direct injection, cylinder deactivation, and auto start-stop features.
Keeping track of which companies have adopted these technologies can be difficult. Thankfully, the EPA’s 2022 Automotive Trends Report includes data that shows which automakers have adopted what technologies.
Understanding the Data
The percentages in this infographic show how 14 major automakers have adopted various fuel-saving technologies into their lineups. The report did not specify if this data is for North American models only.
| Brand | Turbo | Direct Injection | Cylinder Deact. | CVT | 7+ Gears | Start-Stop | Hybrid | PHEV/EV/FC |
|---|---|---|---|---|---|---|---|---|
| Subaru | 22% | 99% | 0% | 95% | 0% | 80% | 0% | 0% |
| Nissan | 5% | 72% | 0% | 87% | 12% | 0% | 0% | 1% |
| Honda | 53% | 79% | 25% | 61% | 38% | 24% | 7% | 0% |
| Mazda | 27% | 100% | 45% | 0% | 0% | 0% | 0% | 0% |
| Toyota | 3% | 0% | 0% | 36% | 38% | 19% | 22% | 2% |
| Kia | 26% | 47% | 0% | 42% | 45% | 50% | 2% | 0% |
| Hyundai | 18% | 44% | 0% | 23% | 46% | 21% | 4% | 2% |
| BMW | 99% | 99% | 0% | 0% | 98% | 64% | 25% | 7% |
| Volkswagen | 77% | 94% | 3% | 0% | 90% | 71% | 20% | 7% |
| Mercedes-Benz | 94% | 100% | 8% | 0% | 100% | 77% | 22% | 0% |
| Tesla | 0% | 0% | 0% | 0% | 0% | 0% | 0% | 100% |
| Ford | 80% | 56% | 21% | 2% | 92% | 83% | 5% | 3% |
| GM | 37% | 91% | 54% | 9% | 74% | 75% | 0% | 1% |
| Stellantis | 13% | 10% | 22% | 1% | 96% | 45% | 15% | 3% |
There are several geographical trends hidden within this dataset. To make them more obvious, we color-coded the 14 automakers by their nationality.
Asian Automakers
Starting from the top of the graphic, we can see that Japanese automakers are big proponents of gasoline direct injection (GDI) engines, as well as continuously variable transmissions (CVT).
With a GDI engine, fuel is injected directly into the combustion chamber at high pressure. This is more precise than the traditional method known as port injection, which results in greater fuel efficiency and lower emissions.
CVT transmissions use pulleys instead of gears to improve fuel efficiency. CVTs are best paired with smaller, lower output engines, which may explain why Japanese automakers (who have a history of building smaller cars) have adopted them so widely.
Note that Toyota is listed as having 0% adoption of direct injection, but this isn’t exactly true. The automaker uses its D4-S system, which is a combination of both port and direct fuel injection.
South Korean automakers, on the other hand, have a more balanced technology profile, adopting a wider number of technologies, but each to a lesser degree.
German Automakers
German automakers are well-known for their expertise in building combustion engines, so it’s no surprise they use turbocharging and direct injection in nearly every model.
They’ve also heavily adopted high gear-count transmissions (7 or more gears), which can not only enable better fuel efficiency, but also faster acceleration. The downside to these transmissions is that they can be very heavy and complex.
Furthermore, German automakers utilize the auto start-stop feature in many of their vehicles, and are tied with Toyota in terms of hybrid adoption.
American & Other Automakers
Ford and GM’s technology profile is similar to the Germans, using turbocharging and direct injection combined with 7+ gear transmissions.
GM uses turbocharging less frequently, but stands out with its high usage of cylinder deactivation technology, at 54% of models. Referred to by GM as Active Fuel Management (AFM), this feature shuts down half of the engine’s cylinders during light driving.
GM is known for its small-block V8 engines, which can be had in many of the company’s models. Given the high cylinder count of a V8, AFM is a clever trick for improving fuel efficiency.
Stellantis, which is a merger between Italian-American Fiat Chrysler and French Peugeot, has not widely adopted many technologies except for the 7+ gear transmission.
Finally there’s Tesla, which does not use any of the aforementioned technologies due to it being a pure electric automaker.
Going The Way of the Dinosaur
The technologies shown in this infographic have helped to bring the average mpg of a new car to record highs in recent years.
Many of these innovations could become obsolete as automakers slowly phase out gasoline engines. In 2021, six major automakers including Ford, Mercedes-Benz, and GM pledged to phase out the sale of new gasoline and diesel-powered cars by 2040.
Other companies such as Porsche believe that the combustion engine still has a future, pointing to synthetic fuels as a means of significantly reducing CO2 emissions.


Green
The Carbon Footprint of Major Travel Methods
Going on a cruise ship and flying domestically are the most carbon-intensive travel methods.


The Carbon Footprint of Major Travel Methods
This was originally posted on our Voronoi app. Download the app for free on iOS or Android and discover incredible data-driven charts from a variety of trusted sources.
Did you know that transport accounts for nearly one-quarter of global energy-related carbon dioxide (CO₂) emissions?
This graphic illustrates the carbon footprints of major travel methods measured in grams of carbon dioxide equivalent (CO₂e) emitted per person to travel one kilometer. This includes both CO₂ and other greenhouse gases.
Data is sourced from Our World in Data, the UK Government’s Department for Energy Security and Net Zero, and The International Council on Clean Transportation, as of December 2022.
These figures should be interpreted as approximations, rather than exact numbers. There are many variables at play that determine the actual carbon footprint in any individual case, including vehicle type or model, occupancy, energy mix, and even weather.
Cruise Ships are the Most Carbon-Intensive Travel Method
According to these estimates, taking a cruise ship, flying domestically, and driving alone are some of the most carbon-intensive travel methods.
Cruise ships typically use heavy fuel oil, which is high in carbon content. The average cruise ship weighs between 70,000 to 180,000 metric tons, meaning they require large engines to get moving.
These massive vessels must also generate power for onboard amenities such as lighting, air conditioning, and entertainment systems.
Short-haul flights are also considered carbon-intensive due to the significant amount of fuel consumed during initial takeoff and climbing altitude, relative to a lower amount of cruising.
| Transportation method | CO₂ equivalent emissions per passenger km |
|---|---|
| Cruise Ship | 250 |
| Short-haul flight (i.e. within a U.S. state or European country) | 246 |
| Diesel car | 171 |
| Gas car | 170 |
| Medium-haul flight (i.e. international travel within Europe, or between U.S. states) | 151 |
| Long-haul flight (over 3,700 km, about the distance from LA to NY) | 147 |
| Motorbike | 113 |
| Bus (average) | 96 |
| Plug-in hybrid | 68 |
| Electric car | 47 |
| National rail | 35 |
| Tram | 28 |
| London Underground | 27 |
| Ferry (foot passenger) | 19 |
| Eurostar (International rail) | 4.5 |
Are EVs Greener?
Many experts agree that EVs produce a lower carbon footprint over time versus traditional internal combustion engine (ICE) vehicles.
However, the batteries in electric vehicles charge on the power that comes straight off the electrical grid—which in many places may be powered by fossil fuels. For that reason, the carbon footprint of an EV will depend largely on the blend of electricity sources used for charging.
There are also questions about how energy-intensive it is to build EVs compared to a comparable ICE vehicle.

-

 Debt1 week ago
How Debt-to-GDP Ratios Have Changed Since 2000
-

 Countries2 weeks ago
Population Projections: The World’s 6 Largest Countries in 2075
-

 Markets2 weeks ago
The Top 10 States by Real GDP Growth in 2023
-

 Demographics2 weeks ago
The Smallest Gender Wage Gaps in OECD Countries
-

 United States2 weeks ago
Where U.S. Inflation Hit the Hardest in March 2024
-

 Green2 weeks ago
Top Countries By Forest Growth Since 2001
-

 United States2 weeks ago
Ranked: The Largest U.S. Corporations by Number of Employees
-

 Maps2 weeks ago
The Largest Earthquakes in the New York Area (1970-2024)