

We compare America's top 10 companies by revenue in 1994 and 2023 to see how the business landscape has changed.
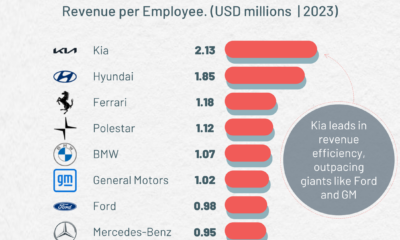

Kia leads in revenue per employee, outpacing other carmakers such as GM and Ford.
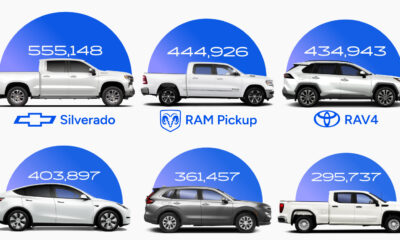

In 2023, nine of the top 10 best-selling vehicles in America were trucks or SUVs. This graphic shows the most popular vehicles overall.
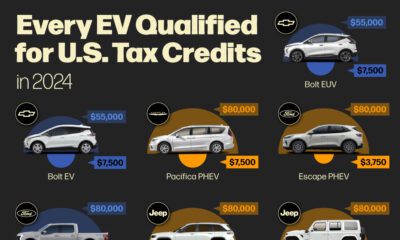

The number of EVs eligible for U.S. tax credits dropped sharply in 2024. Here is every model that qualifies.


SUVs and trucks were the best selling vehicle in almost every US state for 2022, but a few surprises remain.
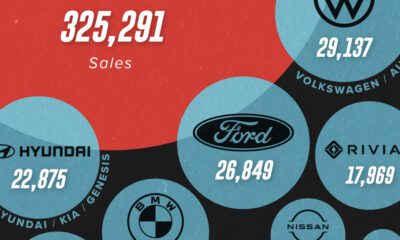

U.S. EV sales continue to be dominated by Tesla, which outsold all of its competitors combined in H1 2023.
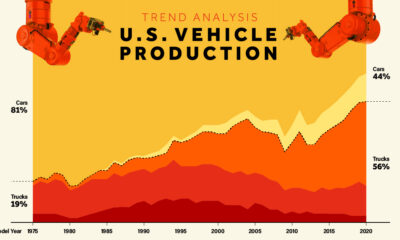

Visualize how U.S. vehicle production has shifted dramatically from cars to trucks, and especially to SUVs, since 1975.


This interactive graphic visualizes U.S. automobile recalls over the past 40 years by type, company, components, and the number of people impacted.


See how 14 major automakers have adopted various fuel-saving technologies in this infographic based on EPA data.


This infographic compares Tesla's impressive profit margins to various Western and Chinese competitors.


 Creator Program