Automotive
How U.S. Vehicle Production Has Shifted Over 45 Years
How U.S. Vehicle Production Has Shifted Over 45 Years
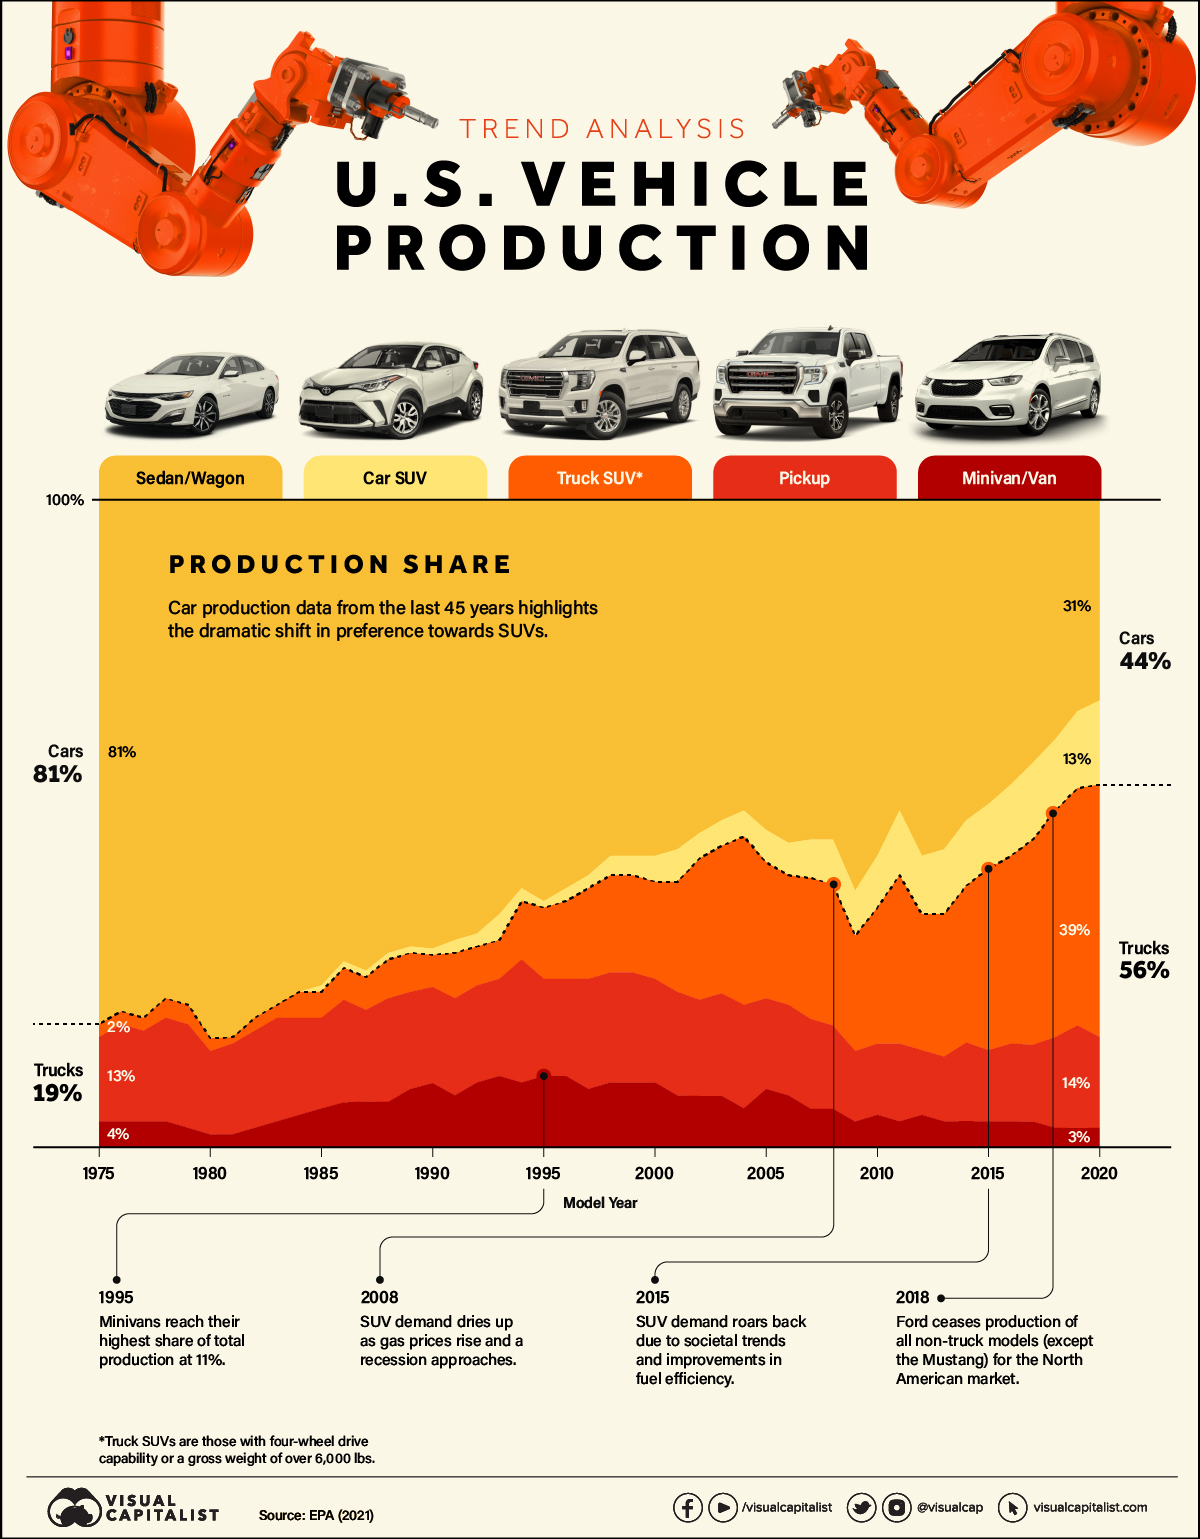
Over the last few decades, vehicle production in the U.S. has dramatically shifted, with SUVs emerging as the indisputable frontrunners.
Once perceived as vehicles solely for off-road capabilities and adventuring (hence the name sport utility vehicle), SUVs soon became a useful transportation alternative for large families. Shortly after, they became the top-selling models for many automakers.
The graphic above uses data on the annual production shares of different vehicle types from the U.S. Environmental Protection Agency (EPA) to explore the factors that have led to the surging popularity of SUVs.
U.S. Vehicle Production: The Rise of SUVs
As SUV production has evolved, they’ve started to blur the line between car and truck classes. The EPA classifies most two-wheel drive SUVs under 6,000 lbs as cars (car SUVs), while those with four-wheel drive or above 6,000 lbs are trucks (truck SUVs).
In the American market, sedans and wagons dominated production from before the 1970s and well into the 1990s. Combined with smaller car SUVs, cars accounted for more than half of U.S. vehicle production well into the 2010s.
But the rapid rise of heavier truck SUVs has shifted the landscape. Sedans and wagons dipped below 50% of market production for the first time in 2004. And by 2017, trucks (including truck SUVs, pickups, and minivans) have been the ones accounting for over half of new vehicle production.
| U.S. Production Share (%) | 1975 | 1980 | 1985 | 1990 | 1995 | 2000 | 2005 | 2010 | 2015 | 2020 |
|---|---|---|---|---|---|---|---|---|---|---|
| Sedan/Wagon | 81% | 84% | 75% | 70% | 62% | 55% | 51% | 55% | 47% | 31% |
| Car SUV | 0% | 0% | 1% | 1% | 1% | 4% | 5% | 8% | 10% | 13% |
| Truck SUV | 2% | 2% | 4% | 5% | 11% | 15% | 21% | 21% | 28% | 39% |
| Pickup | 13% | 13% | 14% | 15% | 15% | 16% | 14% | 11% | 11% | 14% |
| Minivan/Van | 4% | 2% | 6% | 10% | 11% | 10% | 9% | 5% | 4% | 3% |
The growth of SUVs can be partially linked to all-wheel drive systems that gained momentum in the 1980s, with the Audi Quattro winning three rallies in its rookie season of 1981.
During that same time, new SUV models started to gain popularity, like the 1984 Jeep Cherokee—considered the first modern SUV with four doors—and Land Rover’s Range Rover, which entered the North American market in 1987.
By melding the benefits of space, performance, and comfort into one vehicle, SUVs began competing with both vans and station wagons as the quintessential family car. In the 90s, affordable midsize models like the Ford Explorer, Subaru Legacy Outback, and Toyota RAV4 paved the way for more middle-class families to enter the SUV market.
However, SUV production has been prone to fluctuations. Demand first started dropping as gas prices rose in the lead-up to the 2008 recession, which further strained finances and caused families to opt for cheaper non-SUV models. This significantly hurt the American “Big Three” automotive producers (GM, Ford, and Chrysler) at the time, for which trucks and SUVs had become the primary market.
SUV Fuel Efficiency and Millennials
Driven by improvements in fuel efficiency and societal trends, SUV demand roared back over the last 10 years.
Automakers have implemented fuel-saving technologies, such as direct injection and turbocharging, and have used more lightweight materials in construction to further boost engine efficiency.
While fuel efficiency has improved across all types of vehicles over the last four decades, sedans and wagons climbed far earlier in miles per gallon (MPG) scores, while SUVs have only more recently started catching up.
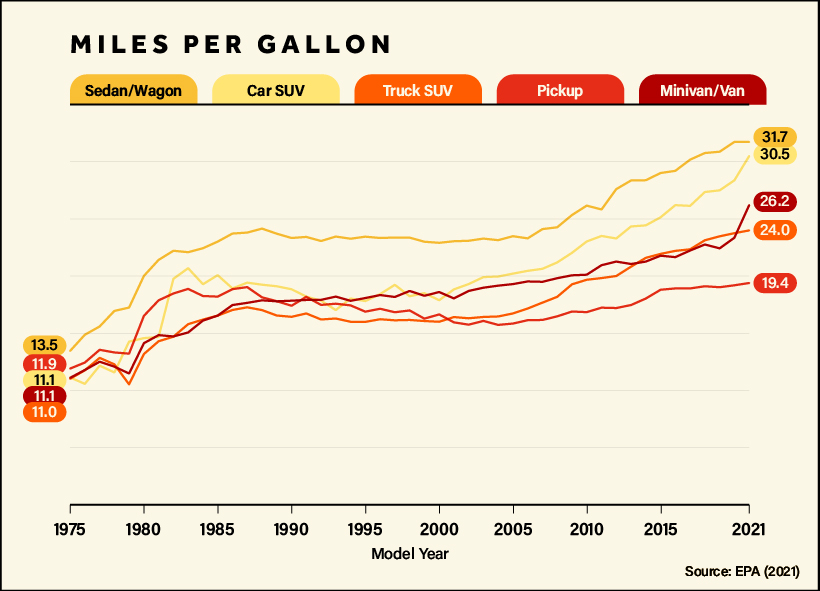
Since 2000, fuel efficiency for sedans and wagons improved by around 38%, while car SUVs saw a jump of 70% over the same time period, with both sitting at just over 30 MPG for 2021 models. Even larger truck SUVs, seen as the epitome of gas-guzzling vehicles, have become as efficient (in MPG terms) as sedans were in the 2000s.
Another factor influencing the market is the surprising entry of millennials, who now represent the majority of the population in the United States. Just a few years ago, automakers were fretting over millennials being a childless, car-less, city-dwelling group who cared little about buying cars or homes.
Fast forward to today—as millennials have aged and their wallets have gotten a little heavier, more of them are buying SUVs to drive to their suburban homes or just to fit their dogs.
SUVs are also benefiting from the shift to electric vehicles. In 2022, SUVs represented 46% of global car sales, and electric SUVs accounted for over half of global electric car sales.


Lithium
Ranked: The Top 10 EV Battery Manufacturers in 2023
Asia dominates this ranking of the world’s largest EV battery manufacturers in 2023.


The Top 10 EV Battery Manufacturers in 2023
This was originally posted on our Voronoi app. Download the app for free on iOS or Android and discover incredible data-driven charts from a variety of trusted sources.
Despite efforts from the U.S. and EU to secure local domestic supply, all major EV battery manufacturers remain based in Asia.
In this graphic we rank the top 10 EV battery manufacturers by total battery deployment (measured in megawatt-hours) in 2023. The data is from EV Volumes.
Chinese Dominance
Contemporary Amperex Technology Co. Limited (CATL) has swiftly risen in less than a decade to claim the title of the largest global battery group.
The Chinese company now has a 34% share of the market and supplies batteries to a range of made-in-China vehicles, including the Tesla Model Y, SAIC’s MG4/Mulan, and various Li Auto models.
| Company | Country | 2023 Production (megawatt-hour) | Share of Total Production |
|---|---|---|---|
| CATL | 🇨🇳 China | 242,700 | 34% |
| BYD | 🇨🇳 China | 115,917 | 16% |
| LG Energy Solution | 🇰🇷 Korea | 108,487 | 15% |
| Panasonic | 🇯🇵 Japan | 56,560 | 8% |
| SK On | 🇰🇷 Korea | 40,711 | 6% |
| Samsung SDI | 🇰🇷 Korea | 35,703 | 5% |
| CALB | 🇨🇳 China | 23,493 | 3% |
| Farasis Energy | 🇨🇳 China | 16,527 | 2% |
| Envision AESC | 🇨🇳 China | 8,342 | 1% |
| Sunwoda | 🇨🇳 China | 6,979 | 1% |
| Other | - | 56,040 | 8% |
In 2023, BYD surpassed LG Energy Solution to claim second place. This was driven by demand from its own models and growth in third-party deals, including providing batteries for the made-in-Germany Tesla Model Y, Toyota bZ3, Changan UNI-V, Venucia V-Online, as well as several Haval and FAW models.
The top three battery makers (CATL, BYD, LG) collectively account for two-thirds (66%) of total battery deployment.
Once a leader in the EV battery business, Panasonic now holds the fourth position with an 8% market share, down from 9% last year. With its main client, Tesla, now sourcing batteries from multiple suppliers, the Japanese battery maker seems to be losing its competitive edge in the industry.
Overall, the global EV battery market size is projected to grow from $49 billion in 2022 to $98 billion by 2029, according to Fortune Business Insights.

-

 Education1 week ago
How Hard Is It to Get Into an Ivy League School?
-

 Technology2 weeks ago
Ranked: Semiconductor Companies by Industry Revenue Share
-

 Markets2 weeks ago
Ranked: The World’s Top Flight Routes, by Revenue
-

 Demographics2 weeks ago
Population Projections: The World’s 6 Largest Countries in 2075
-

 Markets2 weeks ago
The Top 10 States by Real GDP Growth in 2023
-

 Demographics2 weeks ago
The Smallest Gender Wage Gaps in OECD Countries
-

 Economy2 weeks ago
Where U.S. Inflation Hit the Hardest in March 2024
-

 Green2 weeks ago
Top Countries By Forest Growth Since 2001