Energy
Global EV Production: BYD Surpasses Tesla
![]() Subscribe to the Elements free mailing list for more like this
Subscribe to the Elements free mailing list for more like this
Global EV Production: BYD Surpasses Tesla
This was originally posted on Elements. Sign up to the free mailing list to get beautiful visualizations on natural resource megatrends in your email every week.
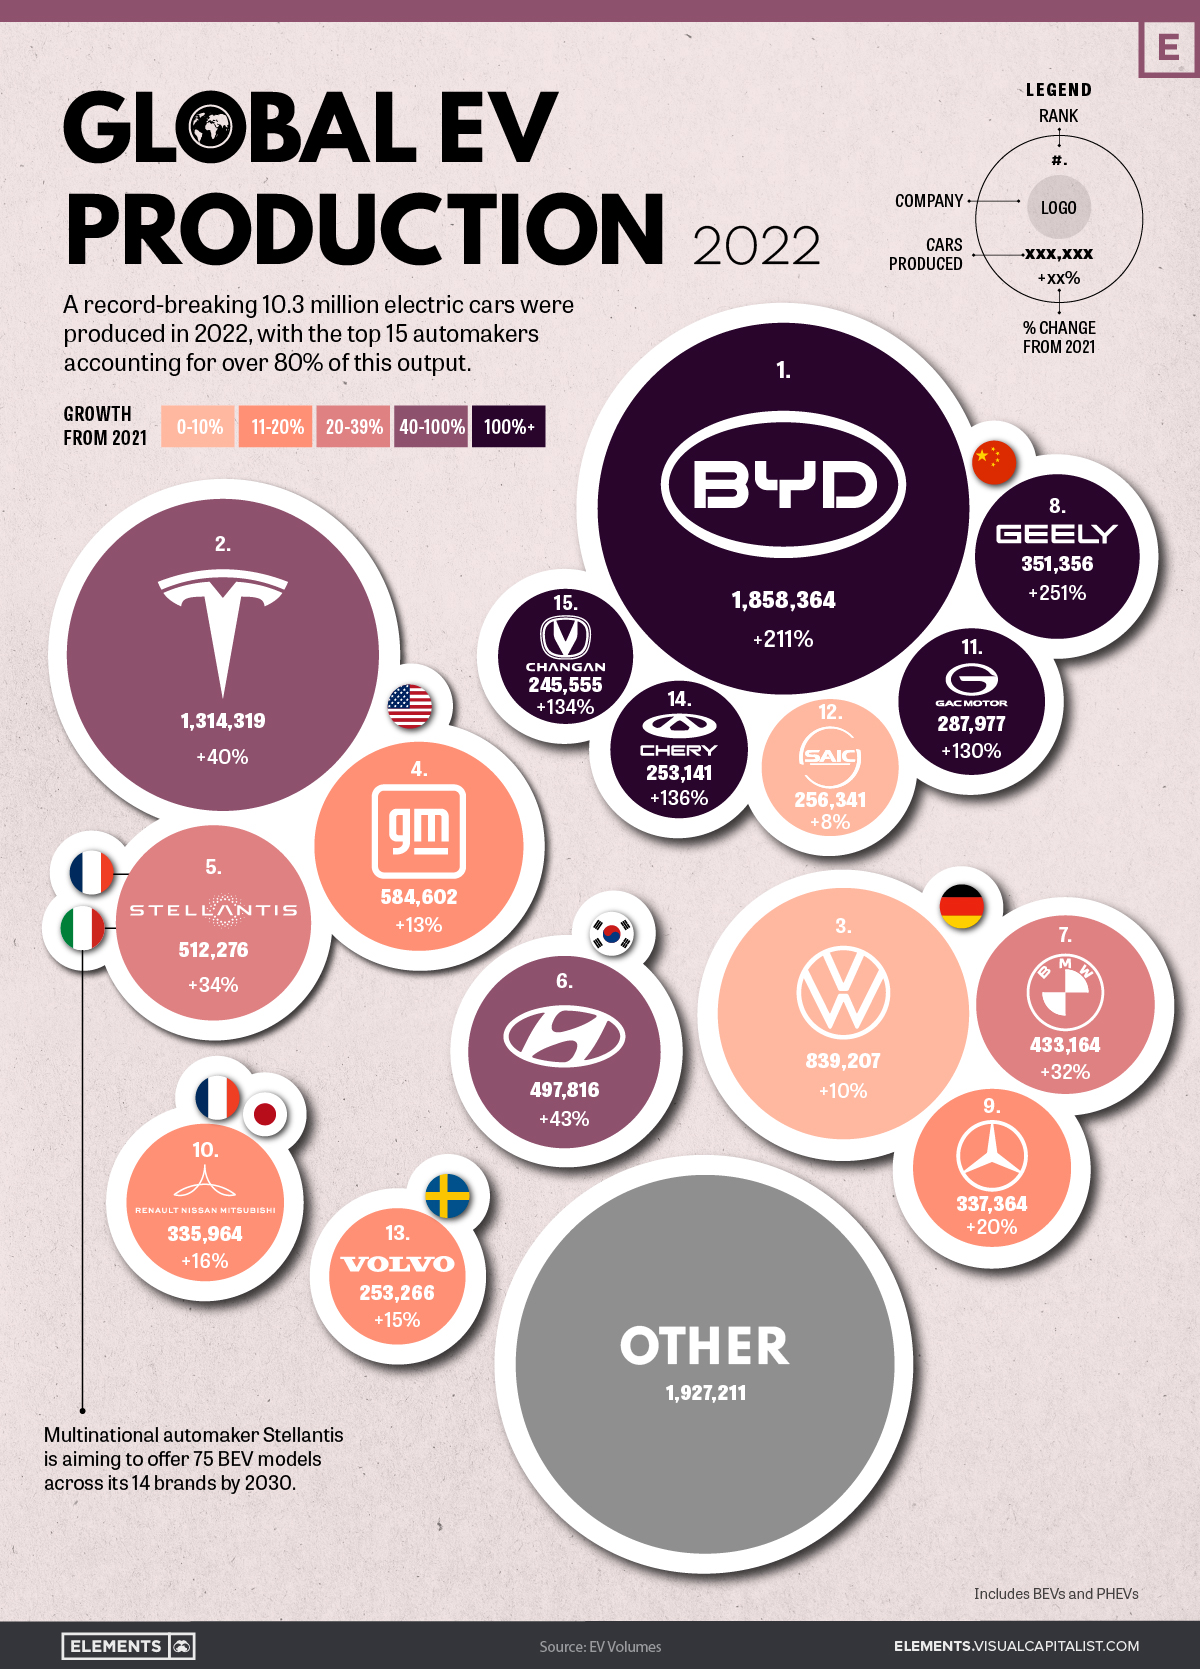
2022 was another historic year for EVs, with annual production surpassing 10 million cars for the first time ever. This represents a sizeable bump up from 2021’s figure of 6.7 million.
In this infographic, we’ve used data from EV Volumes to visualize the top 15 brands by output. The color of each brand’s bubble represents their growth from 2021, with the darker shades depicting a larger percentage increase.
Data Overview and Key Takeaways
The raw data we used to create this infographic is listed below. Volume figures for 2021 were included for convenience.
| Rank | Company | 2022 | 2021 | Growth from 2021 |
|---|---|---|---|---|
| 1 | 🇨🇳 BYD | 1,858,364 | 598,019 | 211% |
| 2 | 🇺🇸 Tesla | 1,314,319 | 936,247 | 40% |
| 3 | 🇩🇪 VW Group | 839,207 | 763,851 | 10% |
| 4 | 🇺🇸 GM (incl. Wuling Motors) | 584,602 | 516,631 | 13% |
| 5 | 🇺🇸 🇮🇹 🇫🇷 Stellantis | 512,276 | 381,843 | 34% |
| 6 | 🇰🇷 Hyundai Motors (incl. Kia) | 497,816 | 348,660 | 43% |
| 7 | 🇩🇪 BMW Group | 433,164 | 329,182 | 32% |
| 8 | 🇨🇳 Geely Auto Group | 351,356 | 99,980 | 251% |
| 9 | 🇩🇪 Mercedes-Benz Group | 337,364 | 281,929 | 20% |
| 10 | 🇫🇷 🇯🇵 Renault-Nissan-Mitsubishi Alliance | 335,964 | 289,473 | 16% |
| 11 | 🇨🇳 GAC Group | 287,977 | 125,384 | 130% |
| 12 | 🇨🇳 SAIC Motor Corp. | 256,341 | 237,043 | 8% |
| 13 | 🇸🇪 Volvo Cars | 253,266 | 220,576 | 15% |
| 14 | 🇨🇳 Chery Auto Co. | 253,141 | 107,482 | 136% |
| 15 | 🇨🇳 Changan Auto Co. | 245,555 | 105,072 | 134% |
| 16 | 🌎 Other (41 companies) | 1,927,211 | 1,326,262 | 45% |
Includes BEVs and PHEVs
BYD Auto
BYD Auto has leaped past Tesla to become the new EV king, boosting its output by a massive 211% in 2022. Given this trajectory, the company will likely become the world’s first automaker to produce over 2 million EVs in a single year.
BYD has a limited presence in non-domestic markets, but this could change rather quickly. The company is planning a major push into Europe, where it expects to build factories in order to avoid EU tariffs on Chinese car imports.
The company is also building a factory in Thailand, to produce right-hand drive models for markets like Australia, New Zealand, and the UK.
Tesla
Tesla increased its output by a respectable 40% in 2022, staying ahead of Western brands like Volkswagen (+10%) and GM (+13%), but falling behind its Chinese rivals such as Geely (+251%).
Whether these Chinese brands can maintain their triple digit growth figures is uncertain, but one thing is clear: Tesla is facing more competition than ever before.
The company is targeting annual production of 20 million cars by 2030, meaning it will need to keep yearly growth rates in the high double digits for the rest of the decade. To support this initiative, Tesla is planning a multi-billion dollar factory in Mexico capable of producing 1 million cars a year.
Hyundai
Hyundai Motor Company, which also owns Kia, posted a similar growth rate to Tesla. The South Korean automaker was a relatively early player in the EV space, revealing the first Hyundai Ioniq in 2016.
In late 2022, several countries including South Korea expressed their disapproval of the Biden administration’s Inflation Reduction Act, which withdrew tax credits on EVs not produced within the United States.
Hyundai is currently building a $5.5 billion EV factory in the state of Georgia, but this facility will not become operational until 2025. In the meantime, South Korea has revised its own EV subsidy program to favor domestic brands.


Energy
Charted: 4 Reasons Why Lithium Could Be the Next Gold Rush
Visual Capitalist has partnered with EnergyX to show why drops in prices and growing demand may make now the right time to invest in lithium.


4 Reasons Why You Should Invest in Lithium
Lithium’s importance in powering EVs makes it a linchpin of the clean energy transition and one of the world’s most precious minerals.
In this graphic, Visual Capitalist partnered with EnergyX to explore why now may be the time to invest in lithium.
1. Lithium Prices Have Dropped
One of the most critical aspects of evaluating an investment is ensuring that the asset’s value is higher than its price would indicate. Lithium is integral to powering EVs, and, prices have fallen fast over the last year:
| Date | LiOH·H₂O* | Li₂CO₃** |
|---|---|---|
| Feb 2023 | $76 | $71 |
| March 2023 | $71 | $61 |
| Apr 2023 | $43 | $33 |
| May 2023 | $43 | $33 |
| June 2023 | $47 | $45 |
| July 2023 | $44 | $40 |
| Aug 2023 | $35 | $35 |
| Sept 2023 | $28 | $27 |
| Oct 2023 | $24 | $23 |
| Nov 2023 | $21 | $21 |
| Dec 2023 | $17 | $16 |
| Jan 2024 | $14 | $15 |
| Feb 2024 | $13 | $14 |
Note: Monthly spot prices were taken as close to the 14th of each month as possible.
*Lithium hydroxide monohydrate MB-LI-0033
**Lithium carbonate MB-LI-0029
2. Lithium-Ion Battery Prices Are Also Falling
The drop in lithium prices is just one reason to invest in the metal. Increasing economies of scale, coupled with low commodity prices, have caused the cost of lithium-ion batteries to drop significantly as well.
In fact, BNEF reports that between 2013 and 2023, the price of a Li-ion battery dropped by 82%.
| Year | Price per KWh |
|---|---|
| 2023 | $139 |
| 2022 | $161 |
| 2021 | $150 |
| 2020 | $160 |
| 2019 | $183 |
| 2018 | $211 |
| 2017 | $258 |
| 2016 | $345 |
| 2015 | $448 |
| 2014 | $692 |
| 2013 | $780 |

3. EV Adoption is Sustainable
One of the best reasons to invest in lithium is that EVs, one of the main drivers behind the demand for lithium, have reached a price point similar to that of traditional vehicle.
According to the Kelly Blue Book, Tesla’s average transaction price dropped by 25% between 2022 and 2023, bringing it in line with many other major manufacturers and showing that EVs are a realistic transport option from a consumer price perspective.
| Manufacturer | September 2022 | September 2023 |
|---|---|---|
| BMW | $69,000 | $72,000 |
| Ford | $54,000 | $56,000 |
| Volkswagon | $54,000 | $56,000 |
| General Motors | $52,000 | $53,000 |
| Tesla | $68,000 | $51,000 |
4. Electricity Demand in Transport is Growing
As EVs become an accessible transport option, there’s an investment opportunity in lithium. But possibly the best reason to invest in lithium is that the IEA reports global demand for the electricity in transport could grow dramatically by 2030:
| Transport Type | 2022 | 2025 | 2030 |
|---|---|---|---|
| Buses 🚌 | 23,000 GWh | 50,000 GWh | 130,000 GWh |
| Cars 🚙 | 65,000 GWh | 200,000 GWh | 570,000 GWh |
| Trucks 🛻 | 4,000 GWh | 15,000 GWh | 94,000 GWh |
| Vans 🚐 | 6,000 GWh | 16,000 GWh | 72,000 GWh |
The Lithium Investment Opportunity
Lithium presents a potentially classic investment opportunity. Lithium and battery prices have dropped significantly, and recently, EVs have reached a price point similar to other vehicles. By 2030, the demand for clean energy, especially in transport, will grow dramatically.
With prices dropping and demand skyrocketing, now is the time to invest in lithium.
EnergyX is poised to exploit lithium demand with cutting-edge lithium extraction technology capable of extracting 300% more lithium than current processes.

-

 Lithium5 days ago
Ranked: The Top 10 EV Battery Manufacturers in 2023
Asia dominates this ranking of the world’s largest EV battery manufacturers in 2023.
-

 Energy1 week ago
The World’s Biggest Nuclear Energy Producers
China has grown its nuclear capacity over the last decade, now ranking second on the list of top nuclear energy producers.
-

 Energy1 month ago
The World’s Biggest Oil Producers in 2023
Just three countries accounted for 40% of global oil production last year.
-

 Energy1 month ago
How Much Does the U.S. Depend on Russian Uranium?
Currently, Russia is the largest foreign supplier of nuclear power fuel to the U.S.
-

 Uranium2 months ago
Charted: Global Uranium Reserves, by Country
We visualize the distribution of the world’s uranium reserves by country, with 3 countries accounting for more than half of total reserves.
-

 Energy3 months ago
Visualizing the Rise of the U.S. as Top Crude Oil Producer
Over the last decade, the United States has established itself as the world’s top producer of crude oil, surpassing Saudi Arabia and Russia.


-

 Science1 week ago
Visualizing the Average Lifespans of Mammals
-

 Markets2 weeks ago
The Top 10 States by Real GDP Growth in 2023
-

 Demographics2 weeks ago
The Smallest Gender Wage Gaps in OECD Countries
-

 United States2 weeks ago
Where U.S. Inflation Hit the Hardest in March 2024
-

 Green2 weeks ago
Top Countries By Forest Growth Since 2001
-

 United States2 weeks ago
Ranked: The Largest U.S. Corporations by Number of Employees
-

 Maps2 weeks ago
The Largest Earthquakes in the New York Area (1970-2024)
-

 Green2 weeks ago
Ranked: The Countries With the Most Air Pollution in 2023