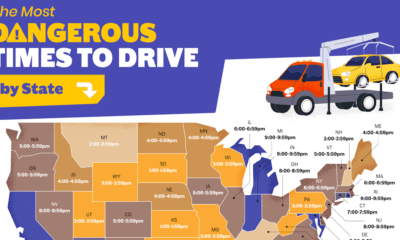

When is the most dangerous time to drive on American roads? We break down the data by hour, day, month, and state.
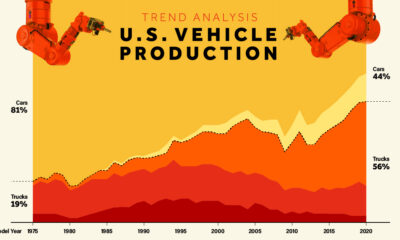

Visualize how U.S. vehicle production has shifted dramatically from cars to trucks, and especially to SUVs, since 1975.
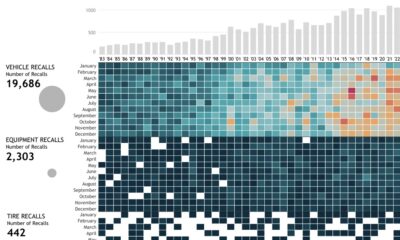

This interactive graphic visualizes U.S. automobile recalls over the past 40 years by type, company, components, and the number of people impacted.
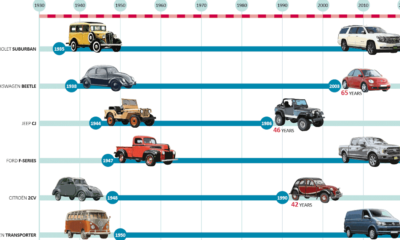

Successful cars come in many shapes and sizes. See which ones have stood the test of time in this infographic.


From Fords in the Midwest to Toyotas on the coasts, here are the best selling vehicles in America, visualized by state.


From American trucks to European sedans, this map shows the best-selling vehicles in the world.
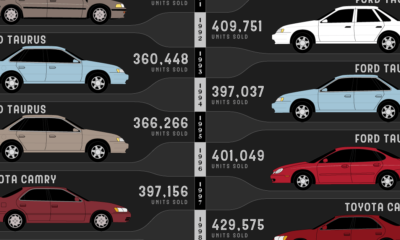

From the Cutlass to the Camry, this graphic shows 40+ years of the most-purchased cars in the U.S.
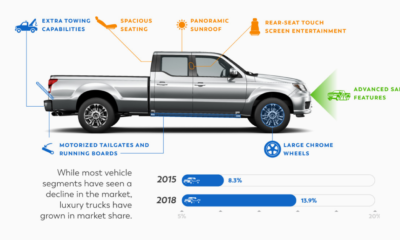

This infographic explores the trends driving the auto industry today, from millennial purchasing habits to luxury trucks.


 Creator Program