

This graphic shows why brass rods are the secure choice for precision-machined and forged parts.


We detail the admission rates and average annual cost for Ivy League schools, as well as the median SAT scores required to be accepted.


This graphic highlights France and Canada as the global leaders when it comes to generating carbon tax revenue.


South Asian nations are the global hotspot for pollution. In this graphic, we rank the world’s most polluted countries according to IQAir.


The earthquake that shook buildings across New York in April 2024 was the third-largest quake in the Northeast U.S. over the past 50 years.
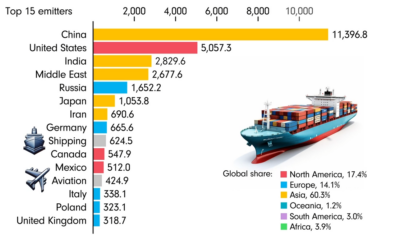

This animated chart by James Eagle uses data from Our World in Data to show the 15 largest carbon emitters between 1850 and 2022.
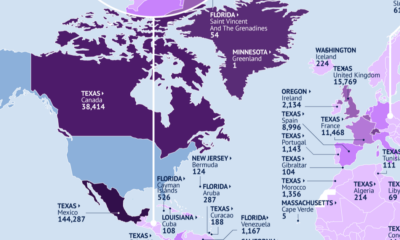

This map identifies the biggest U.S. export markets by state, showing the top partner of each country by value of goods imported.


While the price of gold has reached new record highs in 2024, gold mining stocks are still far from their 2011 peaks.


By 2050, one in six people will be aged 65 or older. Here, we map the growth of the senior population by region.


In this graphic, we illustrate the top ten emerging markets according to their foreign direct investment (FDI) momentum in 2024.


From airbags to firefighting equipment, components made from brass rods play a vital role in creating a safer environment.
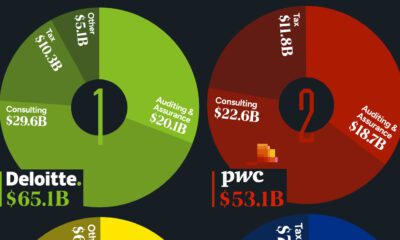

The Big Four accounting firms amassed over $200 billion in combined revenue in 2023.


In this infographic, we map out internet usage by global region based on the latest data from the World Bank.


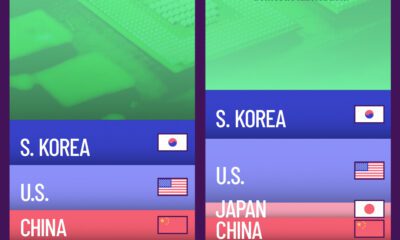
Korean brands dominate the U.S. TV market.
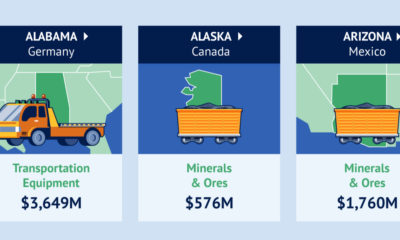

Canada is the top destination for products from 21 states.


North America and East Asia have the speediest internet.


Just three countries accounted for 40% of global oil production last year.


In this graphic we rank the top Swiss watch brands, based on their estimated 2023 market share.


We look at the world's 10 richest people in finance, from Warren Buffett to Michael Bloomberg, in this visualization.


This visualization compares EpiPen prices around the world, with the U.S. having the highest prices by far.


Japan’s birth rate has been declining. Here, we illustrate the number of live births each year compared to the number of annual deaths.


How big are the world's biggest banks? In this visualization, we show the top 50 banks by assets and headquarters location.
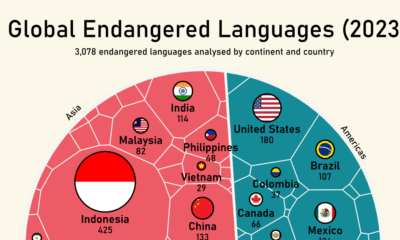

Almost half of the world’s approximately 7,000 languages are considered endangered.


Currently, Russia is the largest foreign supplier of nuclear power fuel to the U.S.

Advanced semiconductors drive technological innovation across various industries. Here, we visualize foundry capacity by country.


In this visualization, we map the populations of major regions at three different points in time: 1900, 2000, and 2050 (forecasted).


BYD is set to surpass Tesla in EV sales for 2024. In this graphic, we illustrate the global electric vehicle market share for 2023.


Foxconn produces roughly two out of every three iPhones.


European hubs top the list, with Monaco requiring $12.9 million to join the top 1% club.
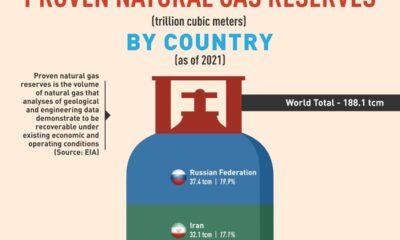

Russia has the biggest reserves, accounting for around 20% of the global total.
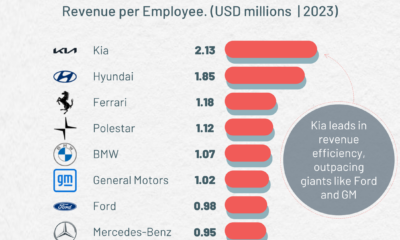

Kia leads in revenue per employee, outpacing other carmakers such as GM and Ford.
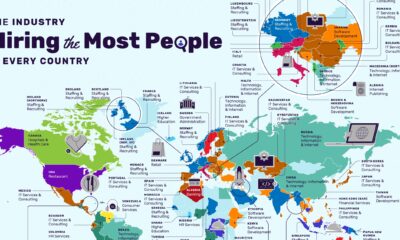

The restaurant industry has the most vacancies in the U.S., followed by non-profit organizations.
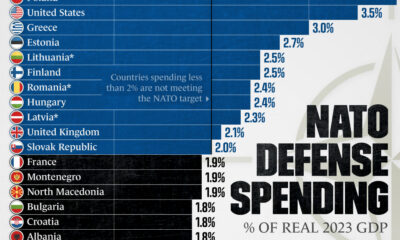

In 2023, only 11 member countries reached NATO’s target of spending 2% of their country's GDP on defense.
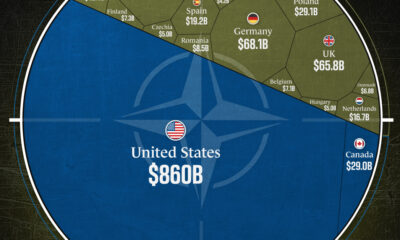

The U.S. accounts for 68% of NATO’s total combined defense spending.
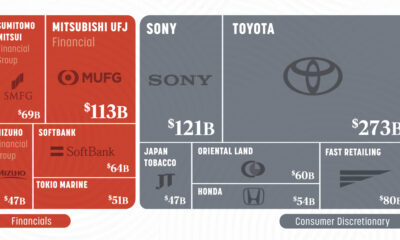

Japan’s top 25 corporations are worth a combined $2 trillion.


The combined wealth of the 10 richest individuals in the world amounts to $1.44 trillion.
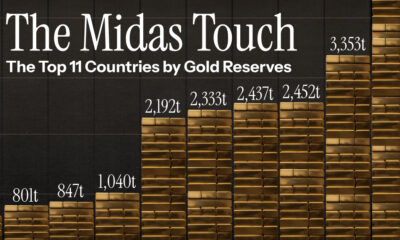

The U.S. holds the world's largest gold reserves, totaling 8,133 tonnes. This graphic showcases the top 11 gold reserves by country.
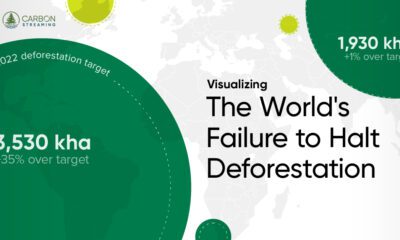

Global deforestation in 2022 rose by 4%, reaching 6.6 million hectares.


Despite the consumer class growing worldwide, some countries are predicted to see a decline in the number of consumers over the next decade.
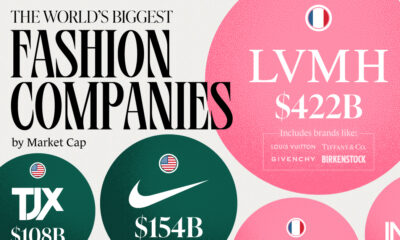

LVMH Moët Hennessy Louis Vuitton (LVMH) is the industry’s biggest player by a wide margin.


This map explores the world’s top 50 science and technology hubs based on the Global Innovation Index 2023 data.


Over the last decade, the United States has established itself as the world's top producer of crude oil, surpassing Saudi Arabia and Russia.


In 2023, iPhones accounted for more than half of Apple's revenue.


This graphic illustrates Panama Canal traffic by shipment category, looking at the total number of shipping crossings and the total tonnage.

Jin Medical, the top IPO of the year, is set to be delisted due to a listing rule violation.
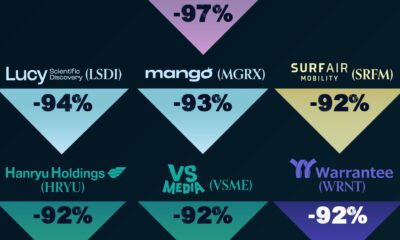

The Chinese EV battery company U Power experienced the worst IPO performance in 2023.


This graphic analyzes social platform usage among U.S. teenagers (13-17 years old), using data from a recent Pew Research study.
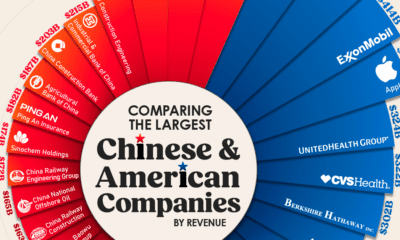

China's largest company, the utility giant State Grid, ranks as the world's third-largest company by revenue, trailing only Walmart and Saudi Aramco.
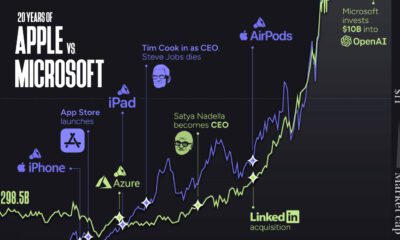

Apple and Microsoft have been switching places as the world’s most valuable company for years. We explore Apple vs. Microsoft over 20 years.
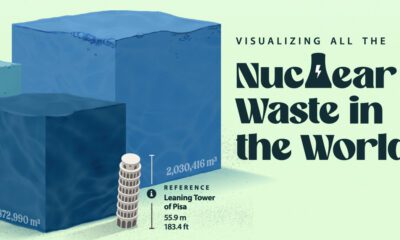

Despite concerns about nuclear waste, high-level radioactive waste constitutes less than 0.25% of all radioactive waste ever generated.


 Creator Program