Misc
Visualizing U.S. EV Sales in H1 2023
Visualizing U.S. EV Sales in H1 2023
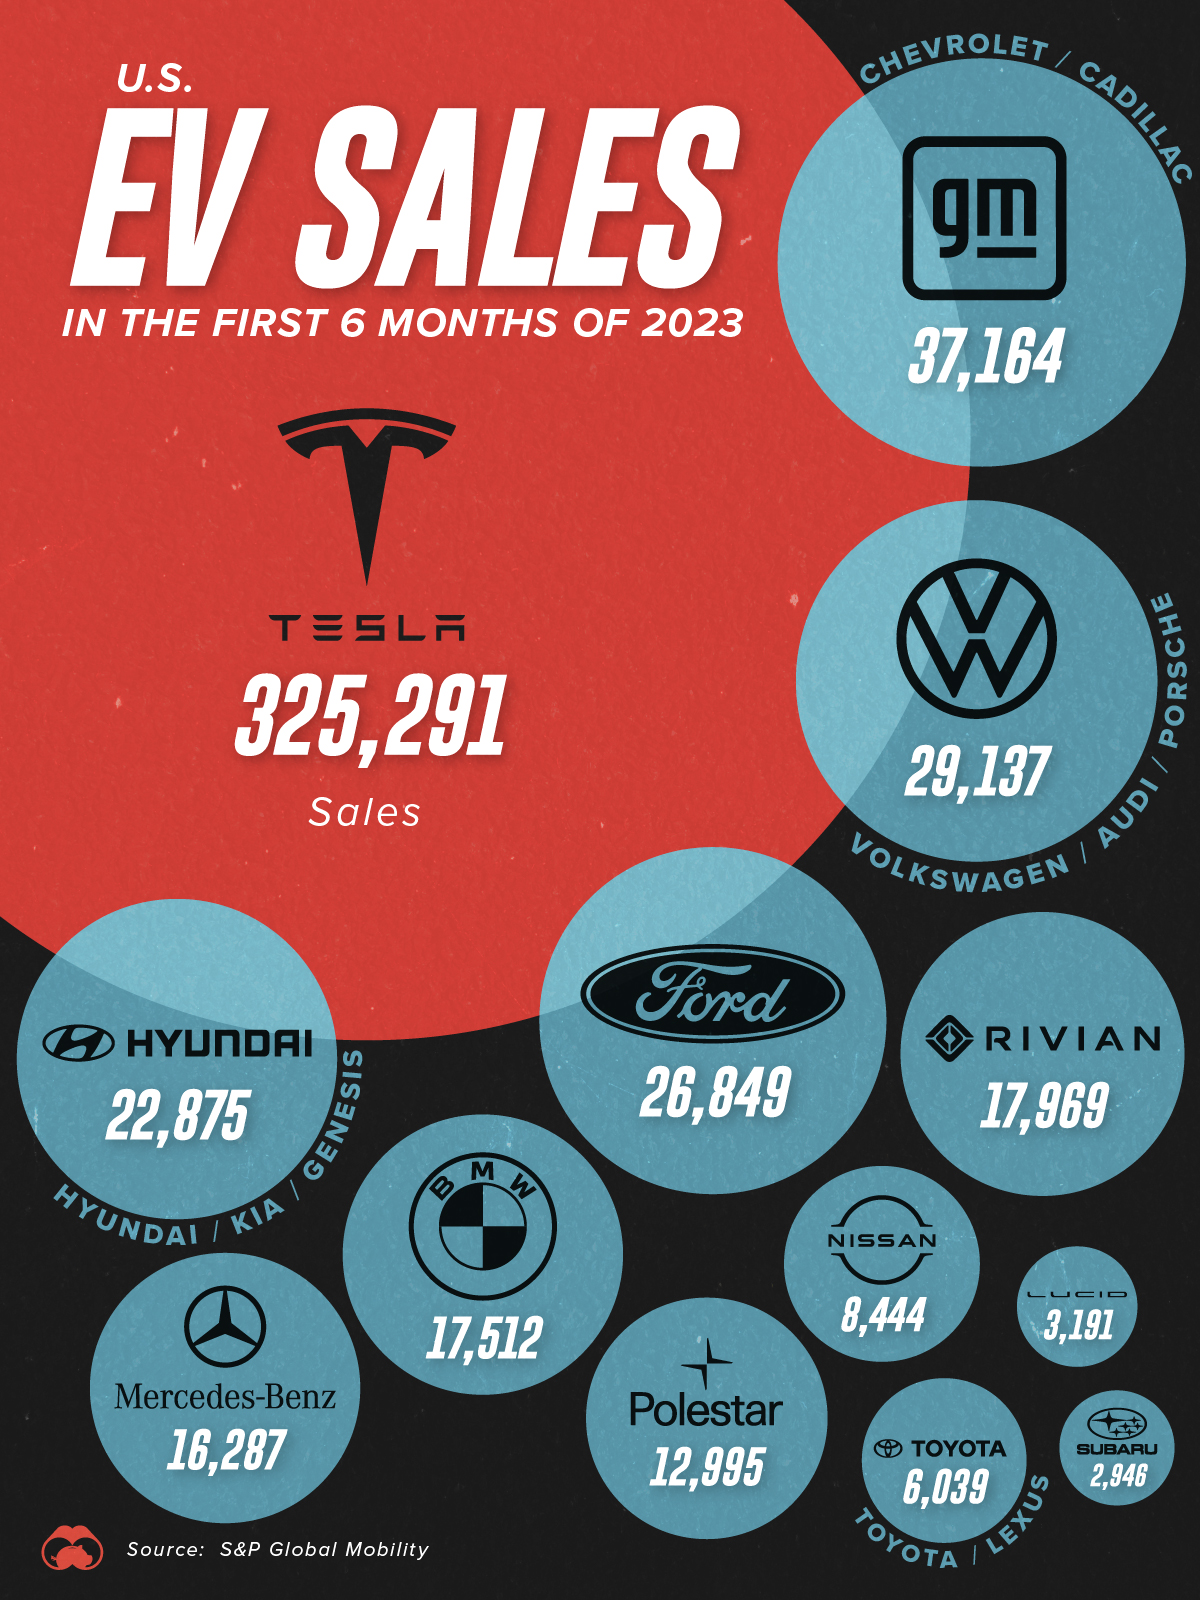
This graphic breaks down the number of EVs each brand sold in the U.S. during the first six months of 2023, from Jan 1 to June 30th.
The main takeaway of this data, which comes from S&P Global Mobility, is that Tesla has outsold all of its rivals combined over the time period. See below for the data in tabular format.
| Automaker | Sales |
|---|---|
| Tesla | 325,291 |
| GM | 37,164 |
| VW Group | 29,137 |
| Ford | 26,849 |
| Hyundai Motor Group | 22,875 |
| Rivian | 17,969 |
| BMW | 17,512 |
| Mercedes-Benz | 16,287 |
| Volvo Polestar | 12,995 |
| Nissan | 8,444 |
| Toyota Motor Corp. | 6,039 |
| Lucid | 3,191 |
| Subaru | 2,946 |
Based on these numbers, Tesla’s H1 2023 sales of 325,291 EVs was 61.5% greater than the collective sales of its competitors (201,408 EVs).
Tesla’s Price War
A key driver of Tesla’s strong performance has been its ability to repeatedly reduce prices on popular models like the Model Y. The price cuts are possible thanks to the company’s relatively strong profit margins, which we covered in a previous graphic.
In that graphic, it was revealed that Tesla earned substantial net profits of $9,574 per vehicle sold, significantly higher than rivals like GM ($2,150), Toyota ($1,197), and Volkswagen ($973).
Tesla’s first round of price cuts came in 2022, with several more following throughout 2023. This has put significant pressure on competitors like Ford, which are already struggling with EV profitability. For example, Ford Model e (Ford’s EV division) has posted losses of $900M in 2021, $2.1B in 2022, and an expected $3B in 2023.
Taking Advantage of Federal EV Credits
Another factor to consider is the Inflation Reduction Act of 2022, which revised tax credits for EVs. In short, EVs (and their batteries) must now be assembled in North America to qualify.
This legislation change has benefitted Tesla, as it means many foreign competitors like VW, BMW, and Hyundai no longer qualify for the credit.


Misc
Visualizing the Most Common Pets in the U.S.
Lions, tigers, and bears, oh my!—these animals do not feature on this list of popular American household pets.


Visualizing The Most Common Pets in the U.S.
This was originally posted on our Voronoi app. Download the app for free on iOS or Android and discover incredible data-driven charts from a variety of trusted sources.
In this graphic, we visualized the most common American household pets, based on 2023-2024 data from the American Pet Products Association (accessed via Forbes Advisor).
Figures represent the number of households that own each pet type, rather than the actual number of each animal. The “small animal” category includes hamsters, gerbils, rabbits, guinea pigs, chinchillas, mice, rats, and ferrets.
What is the Most Popular American Household Pet?
Based on this data, dogs—one of the first domesticated animals—are the most common pets in the United States. In fact, around 65 million households own a dog, and spend an average of $900 a year on their care.
| Rank | Species | Households |
|---|---|---|
| 1 | 🐶 Dog | 65M |
| 2 | 🐱 Cat | 47M |
| 3 | 🐟 Freshwater Fish | 11M |
| 4 | 🐰 Small Animals | 7M |
| 5 | 🐦 Bird | 6M |
| 6 | 🦎 Reptile | 6M |
| 7 | 🐴 Horse | 2M |
| 8 | 🐠 Saltwater Fish | 2M |
Note: Households can own multiple pets, and are counted for all relevant categories.
Cats rank second, at 47 million households, and these smaller felines are a little less expensive to own at $700/year according to Forbes estimates.
But aside from these two juggernauts, there are plenty of other common pet types found in households across the country.
Freshwater fish can be found in 11 million households, along with small animals—rabbits, hamsters, guinea pigs—in 7 million. Meanwhile, nearly 6 million homes have birds or reptiles.
Pet Ownership is on the Rise in America
Forbes found that 66% of all American households (numbering 87 million) own at least one pet, up from 56% in 1988. One third of these (29 million) own multiple pets.
A combination of factors is driving this increase: rising incomes, delayed childbirth, and of course the impact of the pandemic which nearly cleared out animal shelters across the globe.
America’s loneliness epidemic may also be a factor. Fledgling research has shown that single-individual households with pets recorded lower rates of loneliness during the pandemic than those without a pet.

-

 Science7 days ago
Visualizing the Average Lifespans of Mammals
-

 Markets2 weeks ago
The Top 10 States by Real GDP Growth in 2023
-

 Demographics2 weeks ago
The Smallest Gender Wage Gaps in OECD Countries
-

 United States2 weeks ago
Where U.S. Inflation Hit the Hardest in March 2024
-

 Green2 weeks ago
Top Countries By Forest Growth Since 2001
-

 United States2 weeks ago
Ranked: The Largest U.S. Corporations by Number of Employees
-

 Maps2 weeks ago
The Largest Earthquakes in the New York Area (1970-2024)
-

 Green2 weeks ago
Ranked: The Countries With the Most Air Pollution in 2023