Automotive
Charted: Carmakers’ Revenue per Employee
Article/Editing:
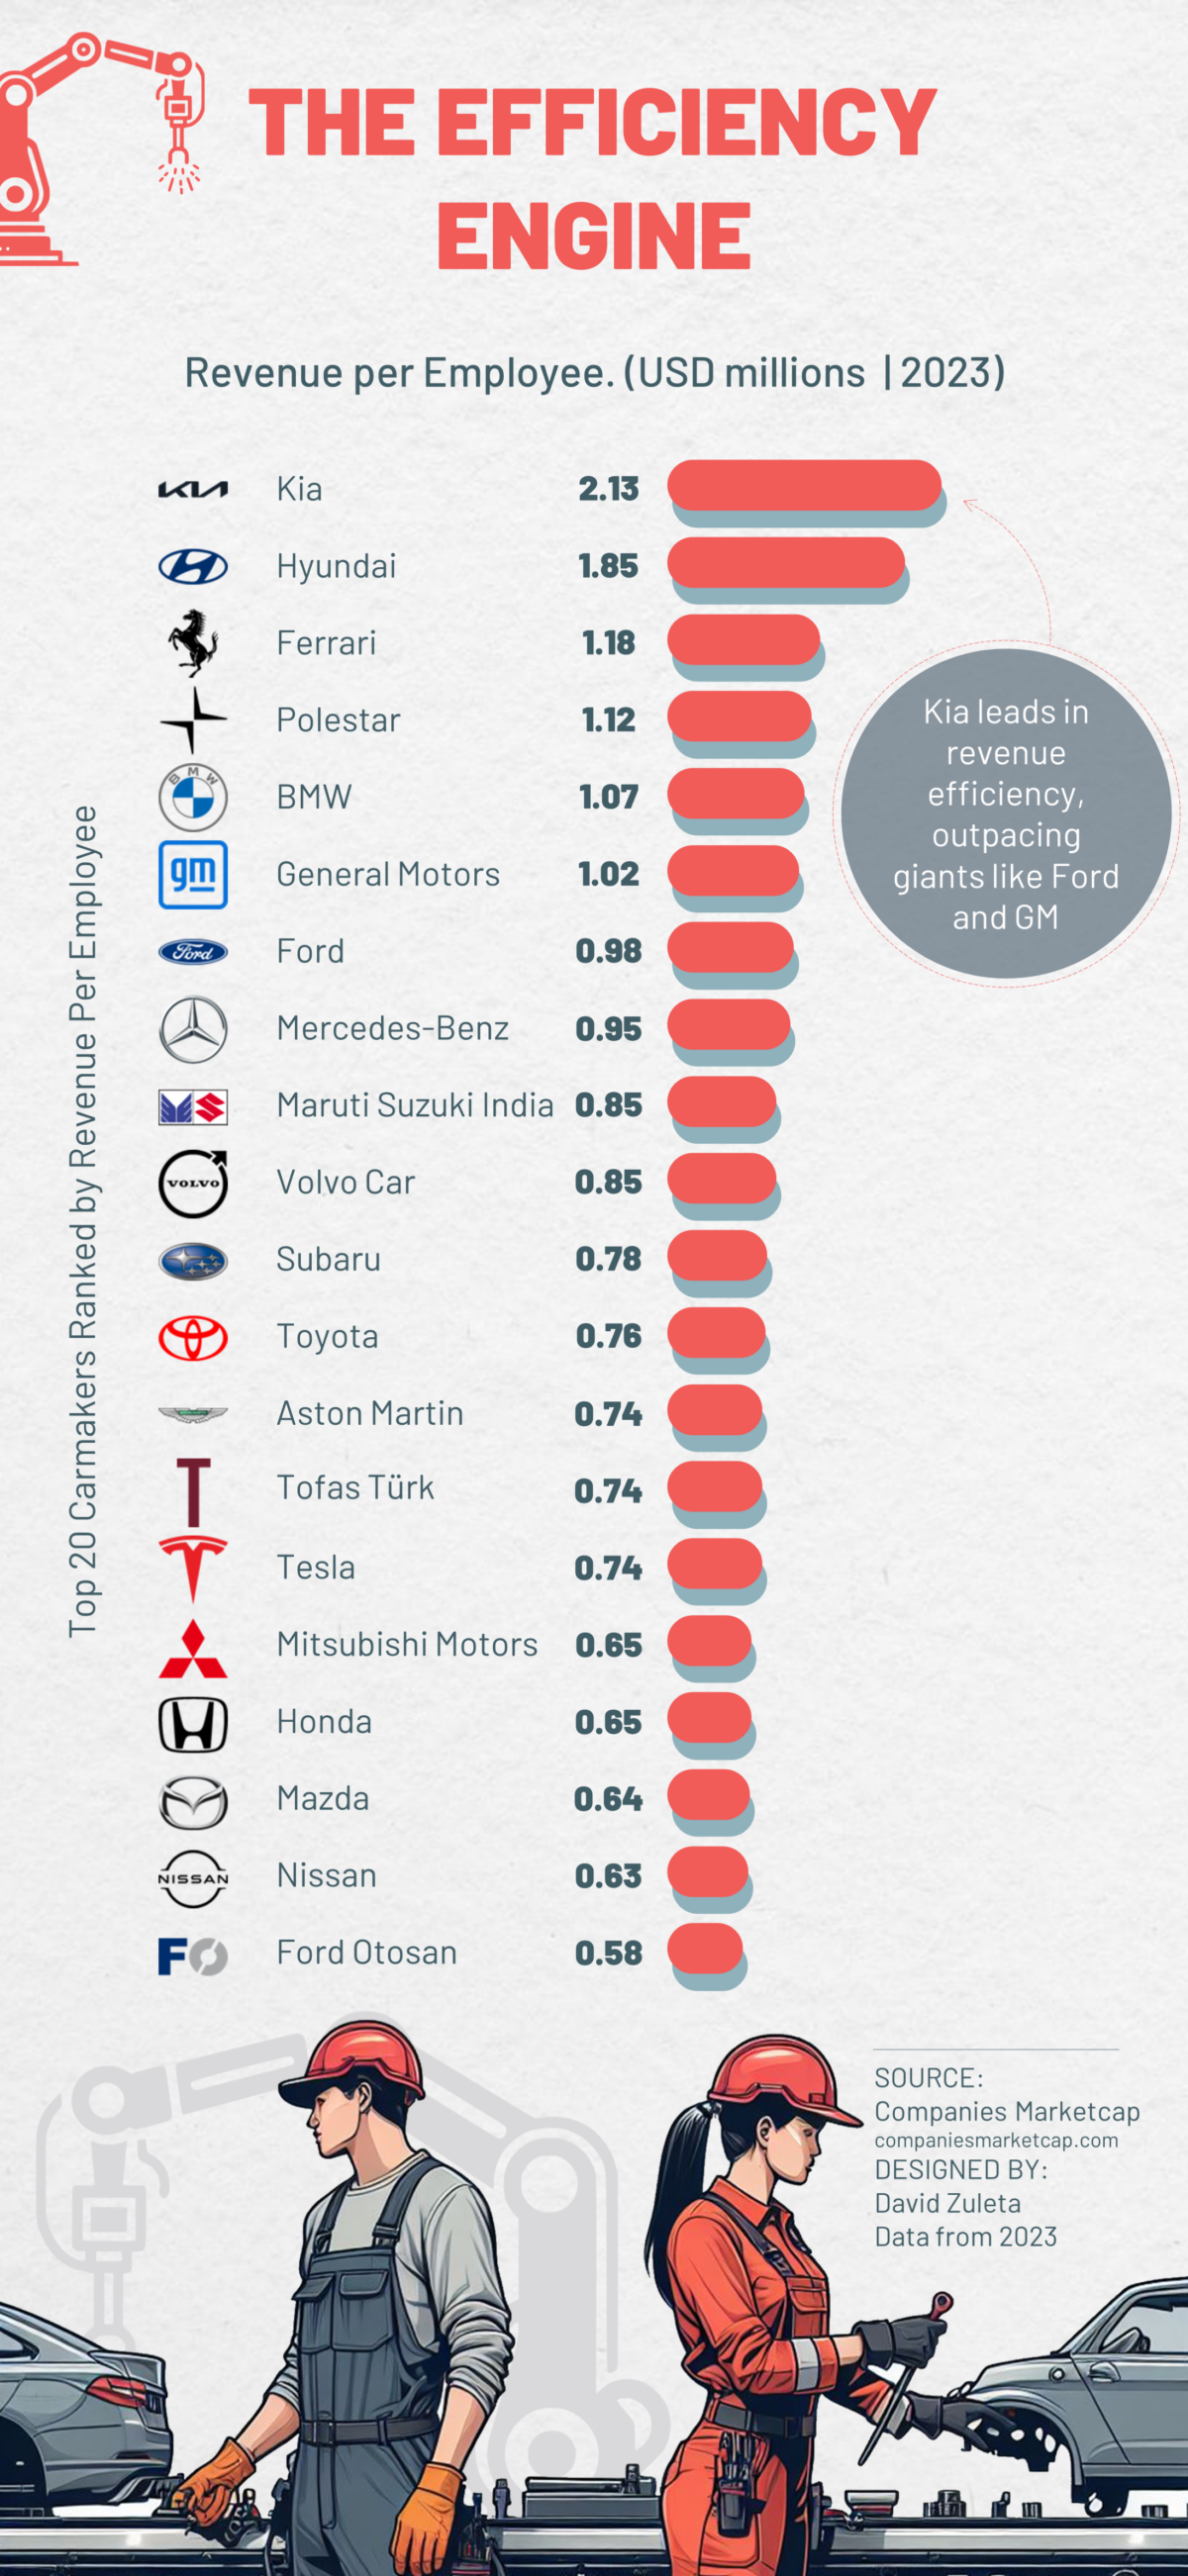
Top 20 Carmakers Ranked by Revenue per Employee
Revenue per employee is an important ratio that roughly measures how much money each employee generates for the company.
In this graphic, creator David Zuleta ranks the top 20 automakers by the revenue generated per employee. Data is based on each company’s market capitalization in 2023, using companiesmarketcap.com.
Kia Leads in Revenue Efficiency
Measuring carmakers’ revenue per employee, Kia emerges as the front-runner, leaving industry giants like Ford and General Motors trailing behind.
The South Korean automaker reached $2.13 million in revenue per employee in 2023. The company’s 34,178 workforce generated a total of $72.67 billion in revenue last year.
| Company | Employees | Revenue (USD billions) | Revenue per Employee (USD millions) |
|---|---|---|---|
| Kia | 34,178 | $72.67 | $2.13 |
| Hyundai | 63,942 | $117.98 | $1.85 |
| Ferrari | 4,961 | $5.85 | $1.18 |
| Polestar | 2,377 | $2.65 | $1.12 |
| BMW | 149,475 | $159.50 | $1.07 |
| General Motors | 167,000 | $169,72 | $1.02 |
| Ford | 173,000 | $169.81 | $0.98 |
| Mercedes-Benz | 169,355 | $160.61 | $0.95 |
| Maruti Suzuki India | 16,259 | $13.82 | $0.85 |
| Volvo Car | 42,300 | $35.89 | $0.85 |
| Subaru | 37,521 | $29.15 | $0.78 |
| Toyota | 375,235 | $283.97 | $0.76 |
| Aston Martin | 2,473 | $1.83 | $0.74 |
| Tofaş Türk | 5,528 | $4.07 | $0.74 |
| Tesla | 127,855 | $94.02 | $0.74 |
| Mitsubishi Motors | 28,428 | $18.59 | $0.65 |
| Honda | 197,039 | $128.24 | $0.65 |
| Mazda | 48,481 | $31.17 | $0.64 |
| Nissan | 131,719 | $82.57 | $0.63 |
| Ford Otosan | 21,007 | $12.26 | $0.58 |
The figure starkly contrasts with the last one on the list, Ford Otosan. The company, equally owned by Ford Motor Company and Koç Holding and based in Turkey, only generated $580,000 per employee, despite its considerable revenue of $12.26 billion.
The presence of Ferrari in the top tier, with $1.18 million per employee, underscores a different strategy where lower volume, high-margin luxury vehicles result in significant revenue per employee.
Among the bigger automakers, BMW and General Motors lead the pack with $1.07 million and $1.02 million per employee, respectively, translating their substantial employee bases into robust revenue streams.
Meanwhile, Tesla, despite its groundbreaking technology, registered revenue of only $740,000 per worker, equal to Aston Martin and Turkish Tofaş Tür. Way ahead of Tesla, another EV maker, Swedish Polestar, achieved $1.12 million and reached fourth place in our rank.
As the data shows, efficiency doesn’t solely reside in the size of the workforce or the legacy of the brand but is also tied to the strategic utilization of human resources.

This article was published as a part of Visual Capitalist's Creator Program, which features data-driven visuals from some of our favorite Creators around the world.


Lithium
Ranked: The Top 10 EV Battery Manufacturers in 2023
Asia dominates this ranking of the world’s largest EV battery manufacturers in 2023.


The Top 10 EV Battery Manufacturers in 2023
This was originally posted on our Voronoi app. Download the app for free on iOS or Android and discover incredible data-driven charts from a variety of trusted sources.
Despite efforts from the U.S. and EU to secure local domestic supply, all major EV battery manufacturers remain based in Asia.
In this graphic we rank the top 10 EV battery manufacturers by total battery deployment (measured in megawatt-hours) in 2023. The data is from EV Volumes.
Chinese Dominance
Contemporary Amperex Technology Co. Limited (CATL) has swiftly risen in less than a decade to claim the title of the largest global battery group.
The Chinese company now has a 34% share of the market and supplies batteries to a range of made-in-China vehicles, including the Tesla Model Y, SAIC’s MG4/Mulan, and various Li Auto models.
| Company | Country | 2023 Production (megawatt-hour) | Share of Total Production |
|---|---|---|---|
| CATL | 🇨🇳 China | 242,700 | 34% |
| BYD | 🇨🇳 China | 115,917 | 16% |
| LG Energy Solution | 🇰🇷 Korea | 108,487 | 15% |
| Panasonic | 🇯🇵 Japan | 56,560 | 8% |
| SK On | 🇰🇷 Korea | 40,711 | 6% |
| Samsung SDI | 🇰🇷 Korea | 35,703 | 5% |
| CALB | 🇨🇳 China | 23,493 | 3% |
| Farasis Energy | 🇨🇳 China | 16,527 | 2% |
| Envision AESC | 🇨🇳 China | 8,342 | 1% |
| Sunwoda | 🇨🇳 China | 6,979 | 1% |
| Other | - | 56,040 | 8% |
In 2023, BYD surpassed LG Energy Solution to claim second place. This was driven by demand from its own models and growth in third-party deals, including providing batteries for the made-in-Germany Tesla Model Y, Toyota bZ3, Changan UNI-V, Venucia V-Online, as well as several Haval and FAW models.
The top three battery makers (CATL, BYD, LG) collectively account for two-thirds (66%) of total battery deployment.
Once a leader in the EV battery business, Panasonic now holds the fourth position with an 8% market share, down from 9% last year. With its main client, Tesla, now sourcing batteries from multiple suppliers, the Japanese battery maker seems to be losing its competitive edge in the industry.
Overall, the global EV battery market size is projected to grow from $49 billion in 2022 to $98 billion by 2029, according to Fortune Business Insights.

-

 Debt1 week ago
How Debt-to-GDP Ratios Have Changed Since 2000
-

 Markets2 weeks ago
Ranked: The World’s Top Flight Routes, by Revenue
-

 Countries2 weeks ago
Population Projections: The World’s 6 Largest Countries in 2075
-

 Markets2 weeks ago
The Top 10 States by Real GDP Growth in 2023
-

 Demographics2 weeks ago
The Smallest Gender Wage Gaps in OECD Countries
-

 United States2 weeks ago
Where U.S. Inflation Hit the Hardest in March 2024
-

 Green2 weeks ago
Top Countries By Forest Growth Since 2001
-

 United States2 weeks ago
Ranked: The Largest U.S. Corporations by Number of Employees