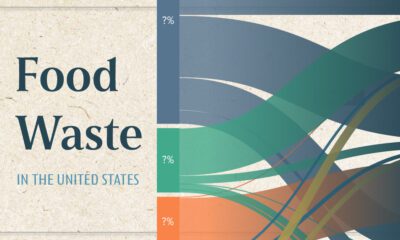

This chart visualizes the flow of the 80 millions tons of food waste in the United States in 2021, using data from ReFED.
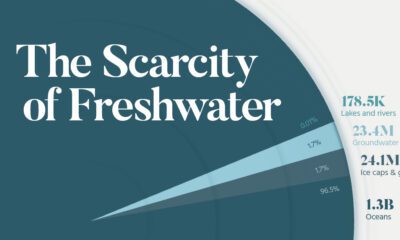

See all of the world's water in one chart, as well as which regions will suffer the greatest from water scarcity.


Global deforestation in 2022 rose by 4%, reaching 6.6 million hectares.


Which foods are linked with high CO2 emissions and high water use? We look at the environmental impacts of food production in this chart.
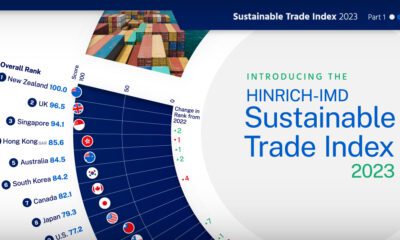

The Sustainable Trade Index 2023 is an annual ranking of the world's most sustainable economies. View this infographic to see the results.
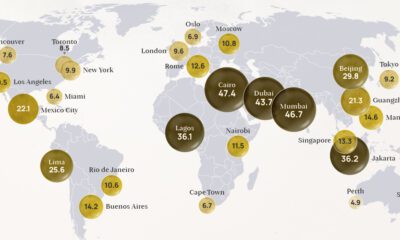

Exploring 2022 average air pollution levels around the world by PM2.5 concentration.
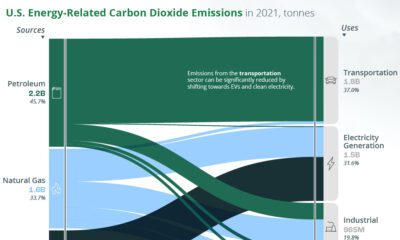

A look at the flow of energy-related CO2 emissions from the sources that generate energy to the sectors that use it.
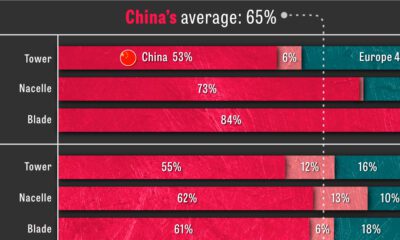

As the market for low-emission solutions expands, China dominates the production of clean energy technologies and their components.
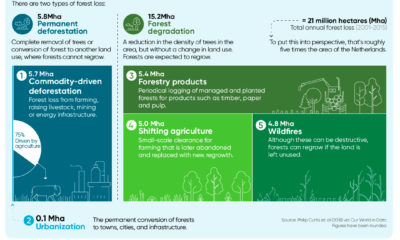

Approximately 15 billion trees are cut down annually across the world. Here's a look at the five major drivers of forest loss. (Sponsored)


Globally around 2 billion tonnes of waste is generated every year and the construction industry is a large contributor.