Ranked: The World’s Most Sustainable Economies in 2023


Ranked: The World’s Most Sustainable Economies in 2023
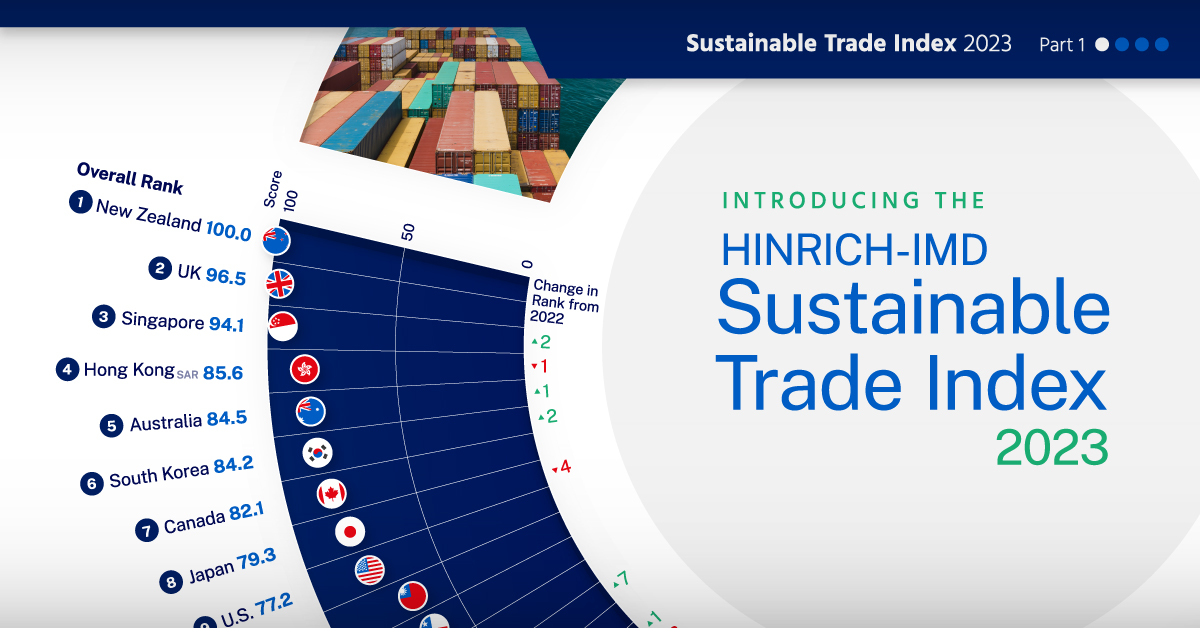
This infographic from The Hinrich Foundation introduces the 2023 edition of the Sustainable Trade Index (STI), an annual ranking of 30 global economies developed in conjunction with the IMD World Competitiveness Center.
The purpose of the STI is to stimulate meaningful discussions about the linkages between global trade and sustainability, serving as a practical tool for governments, policymakers, and researchers.
Overall Ranking for 2023
The overall STI rankings, which are visualized in the first chart of this infographic, are also shown in the table below.
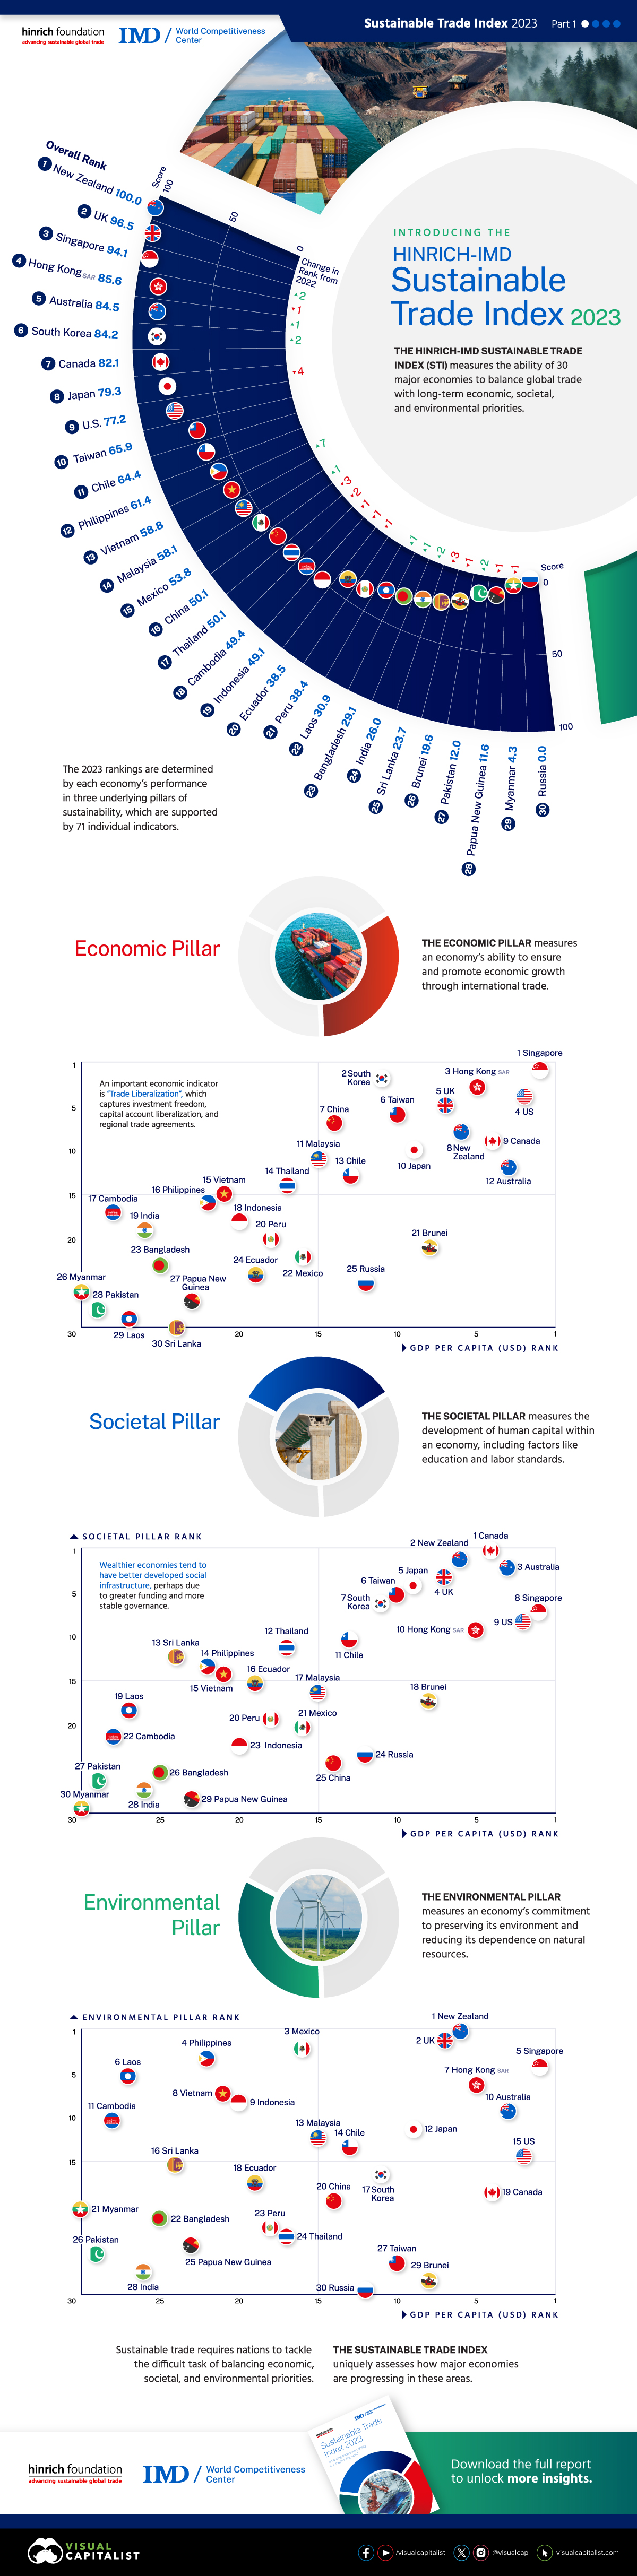
The 2023 rankings are determined by averaging each economy’s performance in three underlying pillars of sustainability (Economic, Societal, and Environmental). Altogether, the three pillars are supported by 71 individual indicators.
| Rank | Economy | 2023 Score | Change in Rank from 2022 |
|---|---|---|---|
| 1 | 🇳🇿 New Zealand | 100.0 | = |
| 2 | 🇬🇧 United Kingdom | 96.5 | = |
| 3 | 🇸🇬 Singapore | 94.1 | 2 |
| 4 | 🇭🇰 Hong Kong, SAR | 85.6 | -1 |
| 5 | 🇦🇺 Australia | 84.5 | 1 |
| 6 | 🇰🇷 South Korea | 84.2 | 2 |
| 7 | 🇨🇦 Canada | 82.1 | = |
| 8 | 🇯🇵 Japan | 79.3 | -4 |
| 9 | 🇺🇸 United States | 77.2 | = |
| 10 | 🇹🇼 Taiwan | 65.9 | = |
| 11 | 🇨🇱 Chile | 64.4 | = |
| 12 | 🇵🇭 Philippines | 61.4 | = |
| 13 | 🇻🇳 Vietnam | 58.8 | 7 |
| 14 | 🇲🇾 Malaysia | 58.1 | = |
| 15 | 🇲🇽 Mexico | 53.8 | 1 |
| 16 | 🇨🇳 China | 50.1 | -3 |
| 17 | 🇹🇭 Thailand | 50.1 | -2 |
| 18 | 🇰🇭 Cambodia | 49.4 | -1 |
| 19 | 🇮🇩 Indonesia | 49.1 | -1 |
| 20 | 🇪🇨 Ecuador | 38.5 | -1 |
| 21 | 🇵🇪 Peru | 38.4 | = |
| 22 | 🇱🇦 Laos | 30.9 | 1 |
| 23 | 🇧🇩 Bangladesh | 29.1 | 1 |
| 24 | 🇮🇳 India | 26.0 | 2 |
| 25 | 🇱🇰 Sri Lanka | 23.7 | -3 |
| 26 | 🇧🇳 Brunei | 19.6 | -1 |
| 27 | 🇵🇰 Pakistan | 12.0 | 2 |
| 28 | 🇵🇬 Papua New Guinea | 11.6 | -1 |
| 29 | 🇲🇲 Myanmar | 4.3 | -1 |
| 30 | 🇷🇺 Russia | 0.0 | = |
As in previous years, the most sustainable economies in the STI continue to be those with relatively small populations and an above-average GDP per capita.
The biggest decliner this year is Japan, which fell four places due to its weaker performance in the Environmental pillar relative to 2022.
On the other hand, Vietnam climbed seven places. The Southeast Asian country improved in all three aspects of the STI, with the biggest jump in the Environmental pillar.
Individual Pillar Rankings
Here’s how each economy ranked in the three underlying pillars of the STI. Do any of these results surprise you?
| Economy | GDP per Capita (rank) | Economic (rank) | Societal (rank) | Environmental (rank) |
|---|---|---|---|---|
| 🇦🇺 Australia | 3 | 12 | 3 | 10 |
| 🇧🇩 Bangladesh | 25 | 23 | 26 | 22 |
| 🇧🇳 Brunei | 8 | 21 | 18 | 29 |
| 🇰🇭 Cambodia | 28 | 17 | 22 | 11 |
| 🇨🇦 Canada | 4 | 9 | 1 | 19 |
| 🇨🇱 Chile | 13 | 13 | 11 | 14 |
| 🇨🇳 China | 14 | 7 | 25 | 20 |
| 🇪🇨 Ecuador | 19 | 24 | 16 | 18 |
| 🇭🇰 Hong Kong, SAR | 5 | 3 | 10 | 7 |
| 🇮🇳 India | 26 | 19 | 28 | 28 |
| 🇮🇩 Indonesia | 20 | 18 | 23 | 9 |
| 🇯🇵 Japan | 9 | 10 | 5 | 12 |
| 🇱🇦 Laos | 27 | 29 | 19 | 6 |
| 🇲🇾 Malaysia | 15 | 11 | 17 | 13 |
| 🇲🇽 Mexico | 16 | 22 | 21 | 3 |
| 🇲🇲 Myanmar | 30 | 26 | 30 | 21 |
| 🇳🇿 New Zealand | 6 | 8 | 2 | 1 |
| 🇵🇰 Pakistan | 29 | 28 | 27 | 26 |
| 🇵🇬 Papua New Guinea | 23 | 27 | 29 | 25 |
| 🇵🇪 Peru | 18 | 20 | 20 | 23 |
| 🇵🇭 Philippines | 22 | 16 | 14 | 4 |
| 🇷🇺 Russia | 12 | 25 | 24 | 30 |
| 🇸🇬 Singapore | 1 | 1 | 8 | 5 |
| 🇰🇷 South Korea | 11 | 2 | 7 | 17 |
| 🇱🇰 Sri Lanka | 24 | 30 | 13 | 16 |
| 🇹🇼 Taiwan | 10 | 6 | 6 | 27 |
| 🇹🇭 Thailand | 17 | 14 | 12 | 24 |
| 🇬🇧 United Kingdom | 7 | 5 | 4 | 2 |
| 🇺🇸 United States | 2 | 4 | 9 | 15 |
| 🇻🇳 Vietnam | 21 | 15 | 15 | 8 |
Due to the structure of the Sustainable Trade Index, economies can only rank highly if they perform well across all three of the underlying pillars. This mirrors the reality of sustainability, where balancing economic, social, and environmental priorities is critical.
Gain More Insights
This infographic was just a preview of what the Sustainable Trade Index has to offer. To learn more, visit The Hinrich Foundation, where you can download additional resources including the entire report for free.

-

 Misc19 hours ago
Visualizing the Most Common Pets in the U.S.
Lions, tigers, and bears, oh my!—these animals do not feature on this list of popular American household pets.
-

 Economy4 days ago
Economic Growth Forecasts for G7 and BRICS Countries in 2024
The IMF has released its economic growth forecasts for 2024. How do the G7 and BRICS countries compare?
-

 United States2 weeks ago
Ranked: The Largest U.S. Corporations by Number of Employees
We visualized the top U.S. companies by employees, revealing the massive scale of retailers like Walmart, Target, and Home Depot.
-

 Economy2 weeks ago
Where U.S. Inflation Hit the Hardest in March 2024
We visualized product categories that saw the highest % increase in price due to U.S. inflation as of March 2024.
-

 Economy1 month ago
G20 Inflation Rates: Feb 2024 vs COVID Peak
We visualize inflation rates across G20 countries as of Feb 2024, in the context of their COVID-19 pandemic peak.
-

 Economy1 month ago
Mapped: Unemployment Claims by State
This visual heatmap of unemployment claims by state highlights New York, California, and Alaska leading the country by a wide margin.