Datastream
Ranked: The World’s 25 Richest Countries by GDP per Capita
The Briefing
- The world GDP per capita continues to grow every year, and is projected to be $13,920 for 2023
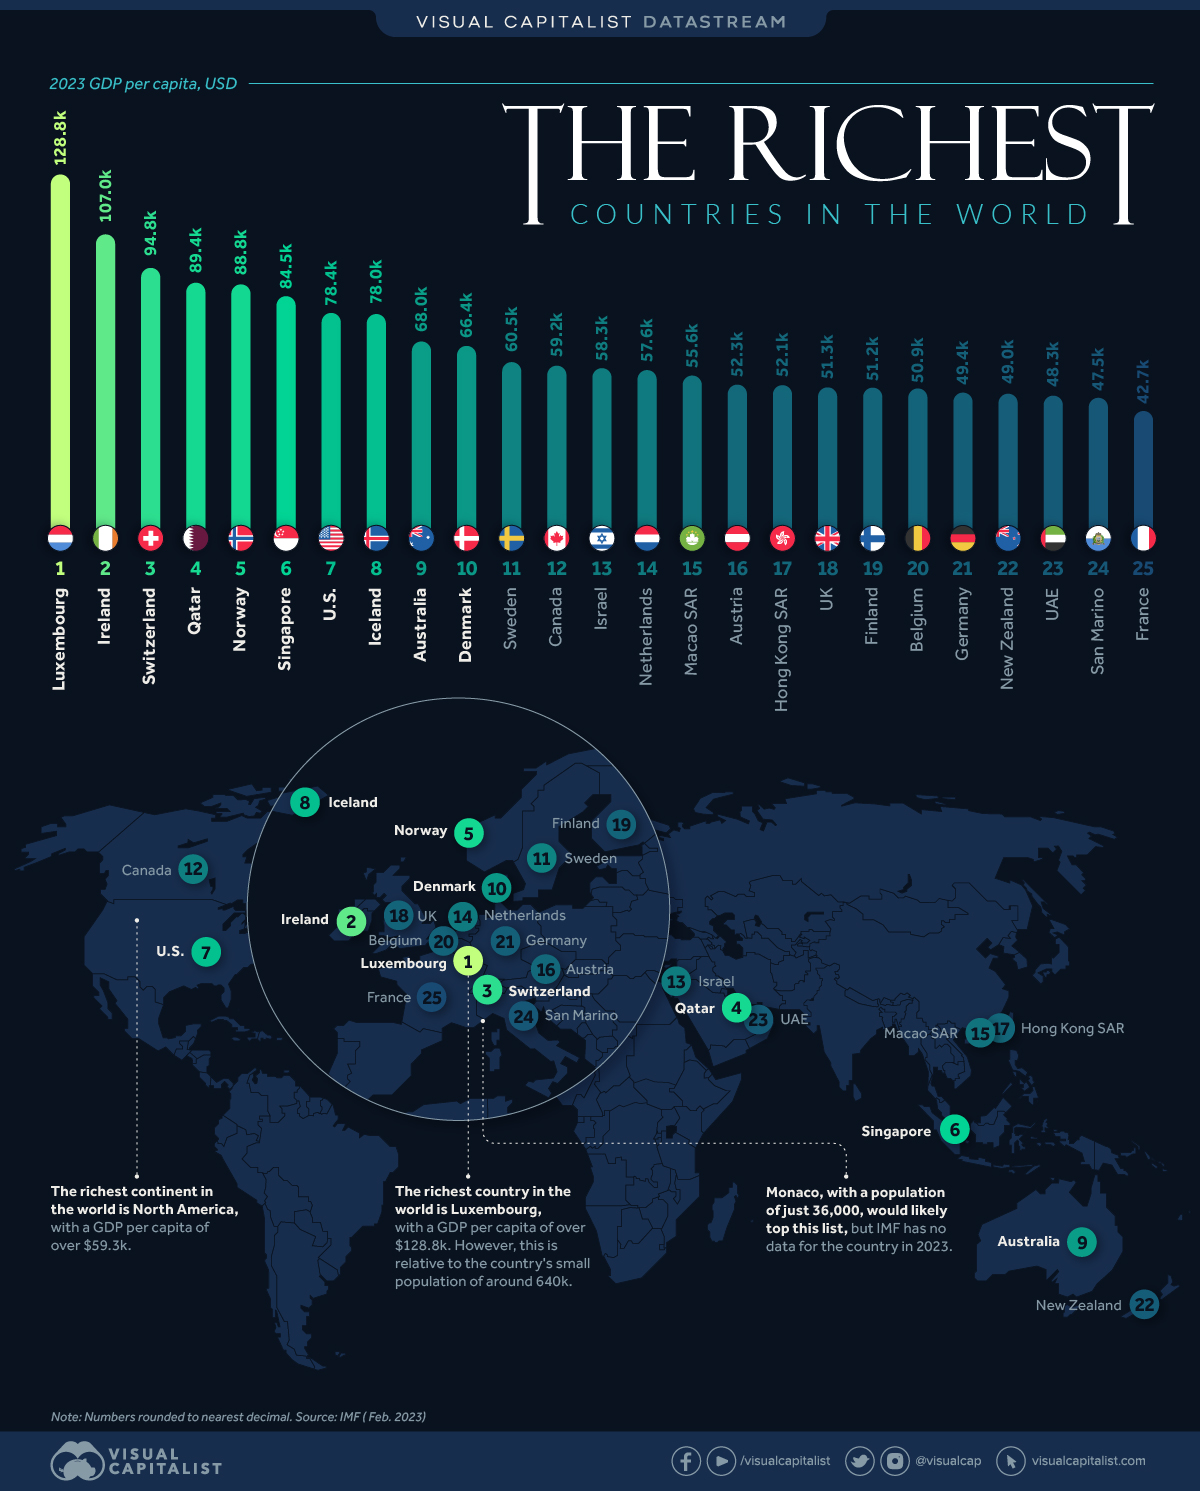
- Luxembourg is the richest country with a GDP per capita of $128,820
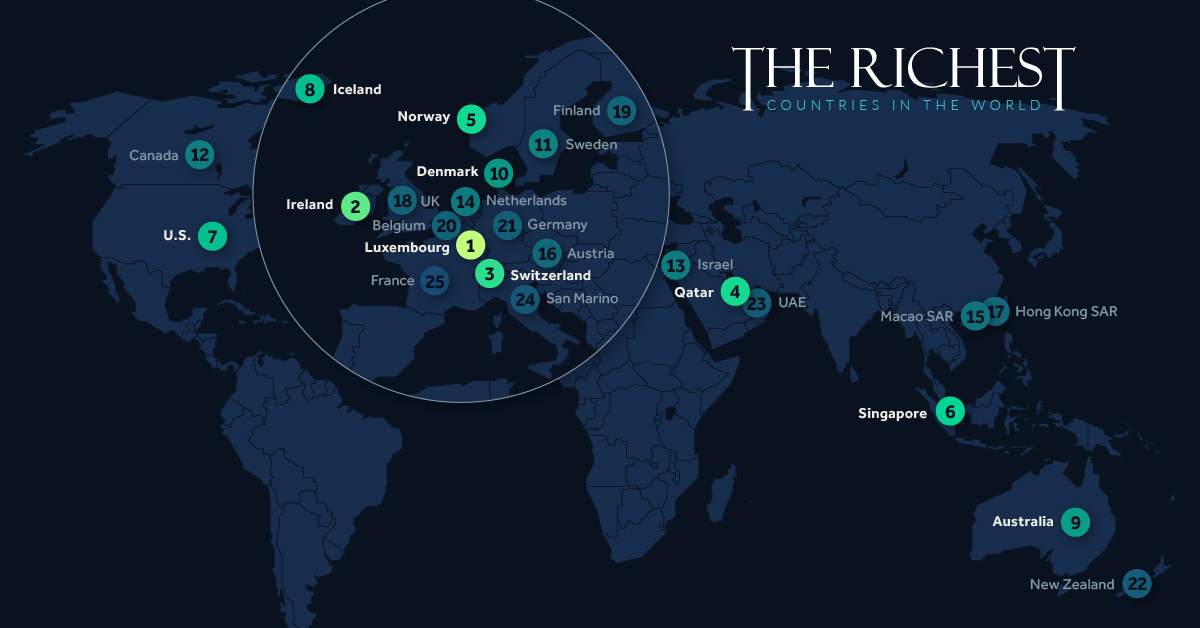
Mapped: Which Are the World’s Richest Countries?
Measuring GDP per capita is a common measure of the economic wealth on a per person basis. This article sorts countries according to the latest International Monetary Fund (IMF) projections on GDP per capita for 2023.
Currently this metric is at $13,920 globally in 2023, up from $13,400 in 2022 and $11,160 in 2020, all nominal figures, not accounting for inflation.
Here is the full ranking of the richest countries in 2023, according to their per capita GDP.
| Country | GDP per capita, USD |
|---|---|
| Luxembourg | $128,820 |
| Ireland | $106,998 |
| Switzerland | $94,835 |
| Qatar | $89,417 |
| Norway | $88,749 |
| Singapore | $84,501 |
| United States | $78,422 |
| Iceland | $77,961 |
| Australia | $68,024 |
| Denmark | $66,394 |
| Sweden | $60,474 |
| Canada | $59,179 |
| Israel | $58,274 |
| Netherlands | $57,629 |
| Macao SAR | $55,645 |
| Austria | $52,317 |
| Hong Kong SAR | $52,133 |
| United Kingdom | $51,287 |
| Finland | $51,178 |
| Belgium | $50,907 |
| Germany | $49,431 |
| New Zealand | $49,009 |
| United Arab Emirates | $48,263 |
| San Marino | $47,485 |
| France | $42,647 |
| Brunei Darussalam | $41,714 |
| Andorra | $40,644 |
| Puerto Rico | $40,361 |
| Taiwan | $36,834 |
| Kuwait | $35,256 |
| Japan | $35,034 |
| South Korea | $34,768 |
| The Bahamas | $34,549 |
| Malta | $33,793 |
| Italy | $33,663 |
| Aruba | $33,483 |
| Estonia | $31,216 |
| Slovenia | $30,841 |
| Cyprus | $30,240 |
| Czech Republic | $29,857 |
| Spain | $29,730 |
| Bahrain | $29,077 |
| Saudi Arabia | $27,009 |
| Lithuania | $25,656 |
| Portugal | $25,487 |
| Iran | $23,620 |
| Oman | $23,194 |
| Latvia | $22,765 |
| Slovak Republic | $22,296 |
| Barbados | $21,637 |
| Greece | $21,372 |
| Seychelles | $21,321 |
| Guyana | $21,163 |
| Trinidad and Tobago | $20,642 |
| Uruguay | $20,464 |
| Saint Kitts and Nevis | $20,393 |
| Hungary | $20,119 |
| Poland | $20,046 |
| Croatia | $18,452 |
| Antigua and Barbuda | $18,265 |
| Chile | $17,282 |
| Panama | $17,154 |
| Maldives | $16,440 |
| Romania | $16,228 |
| Palau | $15,082 |
| Russian Federation | $14,705 |
| Malaysia | $13,943 |
| Costa Rica | $13,806 |
| Argentina | $13,768 |
| China | $13,630 |
| Bulgaria | $13,221 |
| Turkmenistan | $13,021 |
| Kazakhstan | $12,433 |
| Saint Lucia | $11,679 |
| Dominican Republic | $11,406 |
| Mexico | $11,251 |
| Grenada | $11,156 |
| Türkiye, Republic of | $10,864 |
| Montenegro | $10,722 |
| Nauru | $10,097 |
| Equatorial Guinea | $10,087 |
| Serbia | $10,076 |
| Belarus | $9,938 |
| Gabon | $9,850 |
| Mauritius | $9,832 |
| Brazil | $9,572 |
| Saint Vincent and the Grenadines | $9,432 |
| Dominica | $8,840 |
| Thailand | $8,274 |
| Botswana | $7,463 |
| Peru | $7,354 |
| Georgia | $7,270 |
| North Macedonia | $7,263 |
| Bosnia and Herzegovina | $7,082 |
| Colombia | $6,940 |
| Azerbaijan | $6,872 |
| South Africa | $6,813 |
| Albania | $6,592 |
| Ecuador | $6,588 |
| Armenia | $6,568 |
| Libya | $6,392 |
| Belize | $6,382 |
| Iraq | $6,320 |
| Tuvalu | $6,215 |
| Jamaica | $5,985 |
| Paraguay | $5,907 |
| Fiji | $5,869 |
| Moldova | $5,744 |
| Kosovo | $5,560 |
| Tonga | $5,368 |
| Marshall Islands | $5,087 |
| El Salvador | $5,076 |
| Namibia | $5,053 |
| Suriname | $5,037 |
| Guatemala | $5,007 |
| Indonesia | $5,006 |
| Jordan | $4,930 |
| Mongolia | $4,726 |
| Vietnam | $4,683 |
| Egypt | $4,438 |
| Micronesia | $4,309 |
| Eswatini | $4,189 |
| Algeria | $4,163 |
| Samoa | $4,126 |
| Morocco | $4,068 |
| Angola | $3,998 |
| Djibouti | $3,870 |
| Bhutan | $3,856 |
| Bolivia | $3,792 |
| Philippines | $3,764 |
| Tunisia | $3,762 |
| Cabo Verde | $3,709 |
| Papua New Guinea | $3,570 |
| West Bank and Gaza | $3,544 |
| Venezuela | $3,267 |
| Vanuatu | $3,115 |
| Honduras | $3,080 |
| Bangladesh | $2,847 |
| Congo, Republic of | $2,844 |
| India | $2,692 |
| Nigeria | $2,585 |
| Uzbekistan | $2,555 |
| Nicaragua | $2,541 |
| Côte d'Ivoire | $2,497 |
| Mauritania | $2,366 |
| Solomon Islands | $2,330 |
| Zimbabwe | $2,308 |
| São Tomé and Príncipe | $2,302 |
| Kenya | $2,259 |
| Ghana | $2,131 |
| Lao P.D.R. | $1,985 |
| Cambodia | $1,902 |
| Haiti | $1,792 |
| Kiribati | $1,732 |
| Senegal | $1,640 |
| Cameroon | $1,609 |
| Kyrgyz Republic | $1,570 |
| Timor-Leste | $1,495 |
| Guinea | $1,446 |
| Zambia | $1,396 |
| Benin | $1,383 |
| Nepal | $1,372 |
| Tanzania | $1,341 |
| Comoros | $1,303 |
| Ethiopia | $1,227 |
| Lesotho | $1,209 |
| Myanmar | $1,173 |
| Uganda | $1,164 |
| Tajikistan | $1,050 |
| Togo | $1,008 |
| Rwanda | $968 |
| Sudan | $930 |
| Gambia | $883 |
| Mali | $877 |
| Guinea-Bissau | $874 |
| Yemen | $872 |
| Burkina Faso | $832 |
| Liberia | $770 |
| Chad | $755 |
| Congo | $704 |
| Eritrea | $700 |
| Mozambique | $579 |
| Niger | $574 |
| South Sudan | $570 |
| Somalia | $562 |
| Madagascar | $540 |
| Central African Republic | $516 |
| Malawi | $483 |
| Sierra Leone | $472 |
| Burundi | $308 |
Luxembourg, one of the smallest countries in the EU has a population of 634,000 and is the richest country in this ranking with a per capita GDP of nearly $130,000. Formerly known for its steel manufacturing, the country now boasts a large financial services sector, which accounts for the majority of its economic output.
Luxembourg’s per capita GDP is nearly 415 times the per capita GDP of the world’s poorest country, Burundi, at $303.
Ireland is the second-richest country in the world on a GDP per capita basis with $107,000, followed by Switzerland at nearly $94,000. Ireland’s GDP per capita, in particular, has seen a significant increase in recent years due to its pro-business environment, low corporate tax rates, and a highly educated workforce that attracts foreign direct investment.
Most of the richest countries are found in Europe and North America (the top two richest continents), with a per capita GDP of $34,500 and $59,000, respectively. On the other hand, most of the poorest countries in the world are found in Africa.
Both metrics show a continuation of historical trends of regional wealth in the world.
» See a ranking of the poorest countries in the world
Source: International Monetary Fund.
Data note: The IMF dataset does not include data for all countries, and those with missing data for 2023 have not been included in this visualization. Some of the countries not included are: Afghanistan, Bermuda, Cuba, Monaco, Pakistan, Sri Lanka, Syria. For a full list of countries not included, refer to the IMF site. Furthermore, the GDP per capita dataset often updates as currency rates fluctuate, which may lead to slight differences in figures at the time of publishing.


Datastream
Can You Calculate Your Daily Carbon Footprint?
Discover how the average person’s carbon footprint impacts the environment and learn how carbon credits can offset your carbon footprint.


The Briefing
- A person’s carbon footprint is substantial, with activities such as food consumption creating as much as 4,500 g of CO₂ emissions daily.
- By purchasing carbon credits from Carbon Streaming Corporation, you can offset your own emissions and fund positive climate action.
Your Everyday Carbon Footprint
While many large businesses and countries have committed to net-zero goals, it is essential to acknowledge that your everyday activities also contribute to global emissions.
In this graphic, sponsored by Carbon Streaming Corporation, we will explore how the choices we make and the products we use have a profound impact on our carbon footprint.
Carbon Emissions by Activity
Here are some of the daily activities and products of the average person and their carbon footprint, according to Clever Carbon.
| Household Activities & Products | CO2 Emissions (g) |
|---|---|
| 💡 Standard Light Bulb (100 watts, four hours) | 172 g |
| 📱 Mobile Phone Use (195 minutes per day)* | 189 g |
| 👕 Washing Machine (0.63 kWh) | 275 g |
| 🔥 Electric Oven (1.56 kWh) | 675 g |
| ♨️ Tumble Dryer (2.5 kWh) | 1,000 g |
| 🧻 Toilet Roll (2 ply) | 1,300 g |
| 🚿 Hot Shower (10 mins) | 2,000 g |
| 🚙 Daily Commute (one hour, by car) | 3,360 g |
| 🍽️ Average Daily Food Consumption (three meals of 600 calories) | 4,500 g |
| *Phone use based on yearly use of 69kg per the source, Reboxed | |
Your choice of transportation plays a crucial role in determining your carbon footprint. For instance, a 15 km daily commute to work on public transport generates an average of 1,464 g of CO₂ emissions. Compared to 3,360 g—twice the volume for a journey the same length by car.
By opting for more sustainable modes of transport, such as cycling, walking, or public transportation, you can significantly reduce your carbon footprint.
Addressing Your Carbon Footprint
One way to compensate for your emissions is by purchasing high-quality carbon credits.
Carbon credits are used to help fund projects that avoid, reduce or remove CO₂ emissions. This includes nature-based solutions such as reforestation and improved forest management, or technology-based solutions such as the production of biochar and carbon capture and storage (CCS).
While carbon credits offer a potential solution for individuals to help reduce global emissions, public awareness remains a significant challenge. A BCG-Patch survey revealed that only 34% of U.S. consumers are familiar with carbon credits, and only 3% have purchased them in the past.
About Carbon Streaming
By financing the creation or expansion of carbon projects, Carbon Streaming Corporation secures the rights to future carbon credits generated by these sustainable projects. You can then purchase these carbon credits to help fund climate solutions around the world and compensate for your own emissions.
Ready to get involved?
>> Learn more about purchasing carbon credits at Carbon Streaming

-

 Maps2 weeks ago
Mapped: Average Wages Across Europe
-

 Money1 week ago
Which States Have the Highest Minimum Wage in America?
-

 Real Estate1 week ago
Ranked: The Most Valuable Housing Markets in America
-

 Markets1 week ago
Charted: Big Four Market Share by S&P 500 Audits
-

 AI1 week ago
The Stock Performance of U.S. Chipmakers So Far in 2024
-

 Automotive1 week ago
Almost Every EV Stock is Down After Q1 2024
-

 Money2 weeks ago
Where Does One U.S. Tax Dollar Go?
-

 Green2 weeks ago
Ranked: Top Countries by Total Forest Loss Since 2001