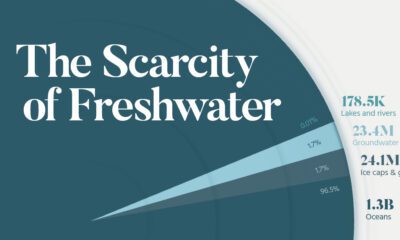

See all of the world's water in one chart, as well as which regions will suffer the greatest from water scarcity.
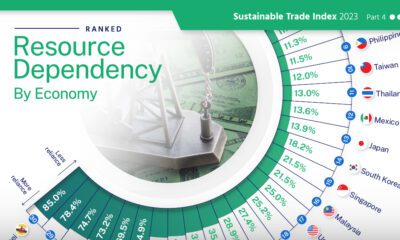

High resource dependency in trade makes countries more susceptible to market fluctuations and climate change.
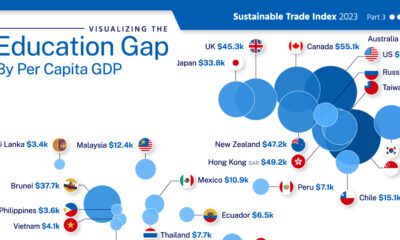

This graphic adds visual context to the global education gap, using data from 29 major economies.
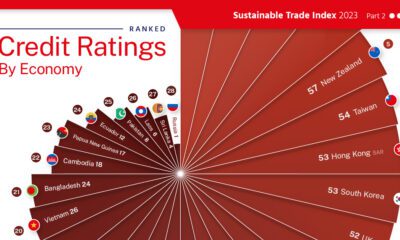

This graphic visualizes 30 country's credit ratings, using data from the 2023 Sustainable Trade Index.
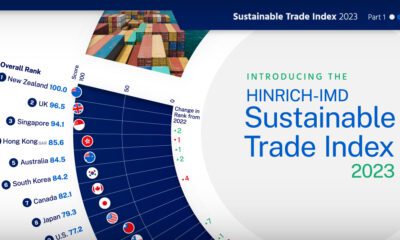

The Sustainable Trade Index 2023 is an annual ranking of the world's most sustainable economies. View this infographic to see the results.
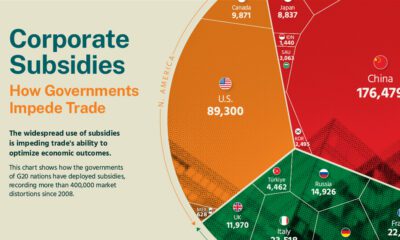

The Hinrich Foundation visualizes the impact of corporate subsidies by G20 nations between 2008 and Q1 2023.
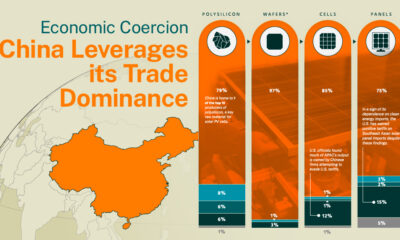

The Hinrich Foundation explores China's use of economic coercion and the implications of its control over the solar energy sector.
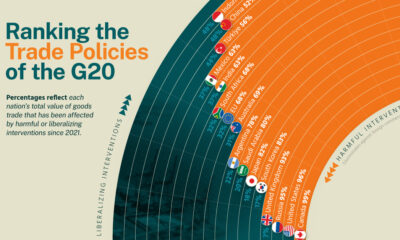

We analyze recent trade policies implemented by G20 members to determine whether they are liberalizing or harmful.
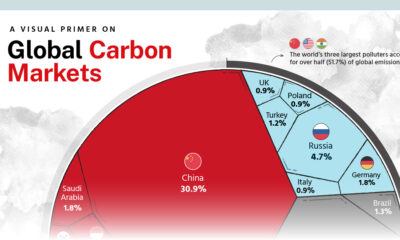

We highlight key findings from the Hinrich Foundation’s latest report on carbon markets, produced in partnership with Visual Capitalist.
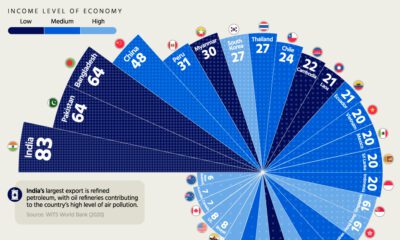

Which economies have hazy air, and which ones enjoy mostly clear skies? Find out in this geographic breakdown of air pollution levels.


