Visualizing the Global Education Gap


Visualizing the Global Education Gap
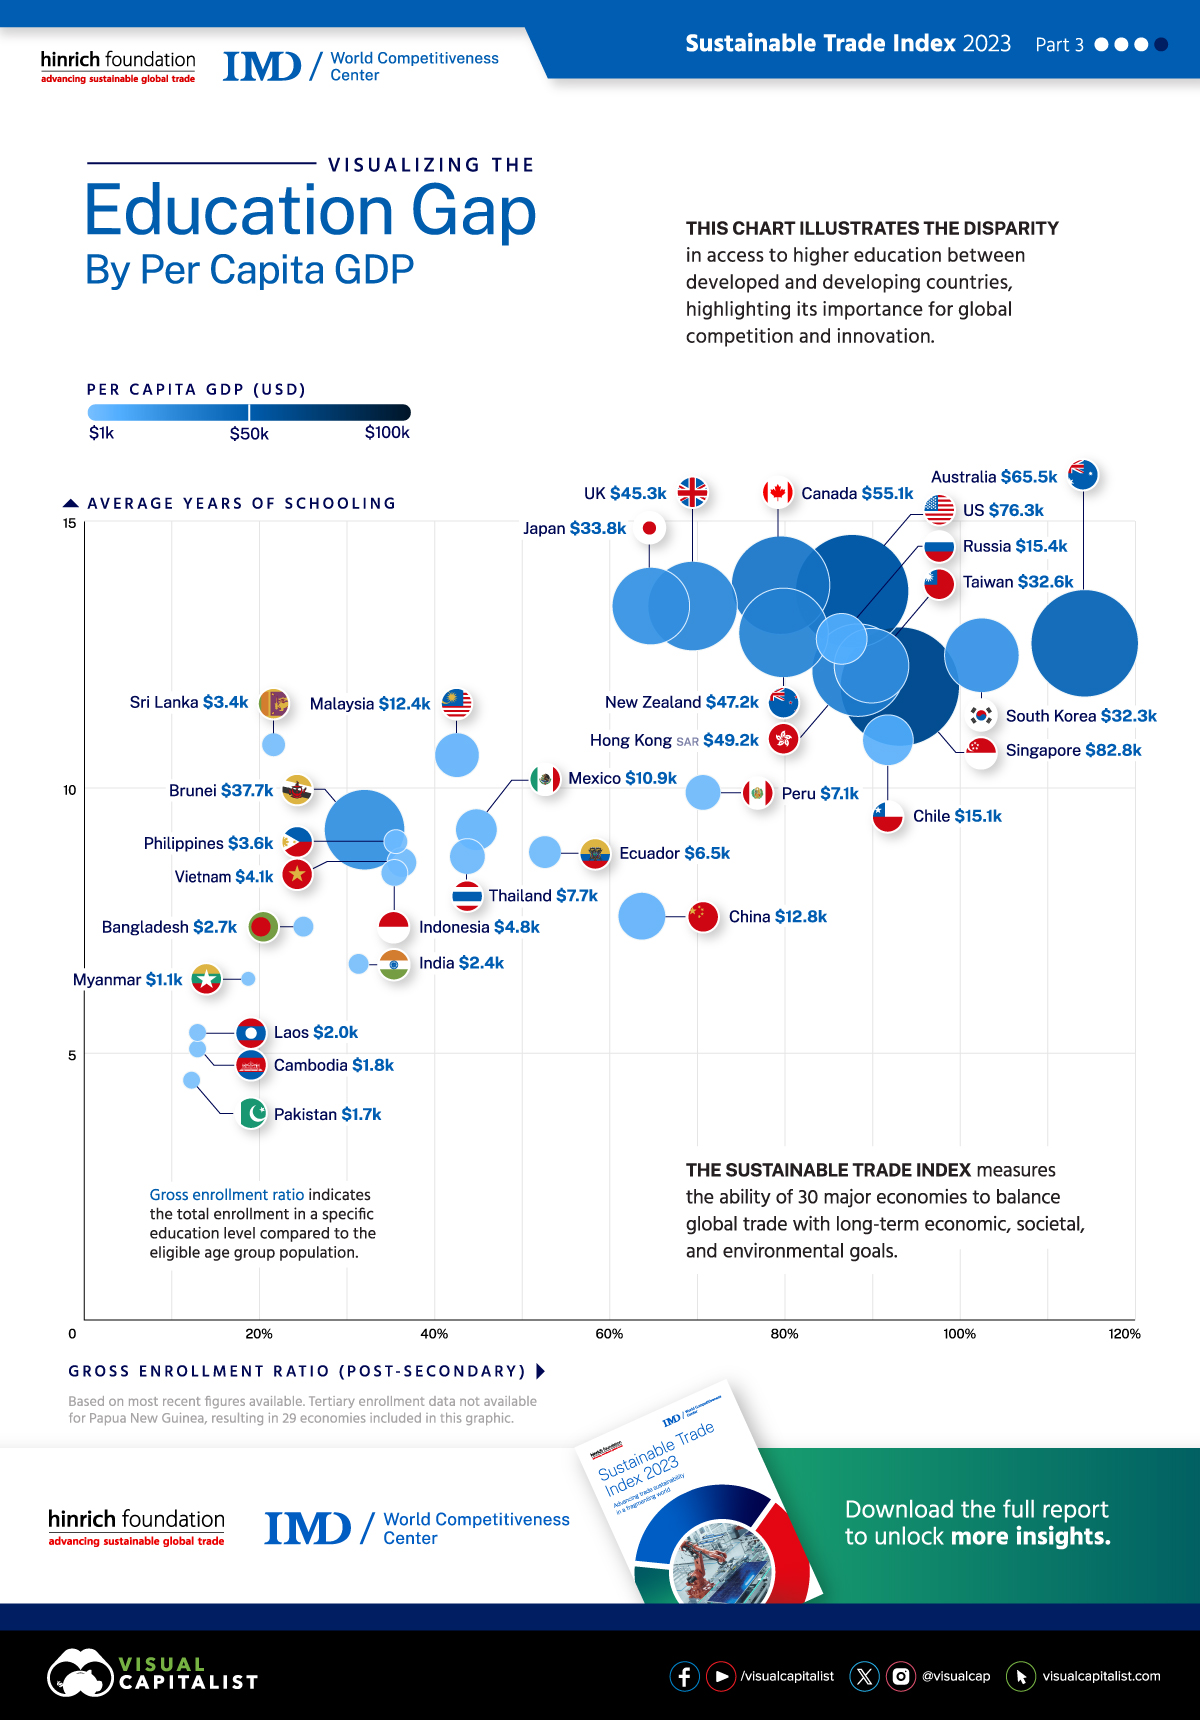
The global education gap refers to disparities in educational access that exist between higher- and lower-income countries. It exists for various reasons, including lack of resources, political instability, and outdated technology.
This graphic from The Hinrich Foundation provides visual context to the global education gap by ranking 29 major economies by two metrics: 1) average years of schooling, and 2) gross enrollment ratio.
The analysis comes from the 2023 Sustainable Trade Index (STI), which the Hinrich Foundation produced in collaboration with the IMD World Competitiveness Center.
Data Overview
The data used to create this graphic is included in the table below.
The gross enrollment ratio refers to the total number of students enrolled in post-secondary education, regardless of age, expressed as a percentage of the corresponding official age group. The gross enrollment ratio can sometimes exceed 100%, due to returning mature students.
| Economy | Gross Enrollment Ratio (Post-secondary) (%) | Average Years of Schooling | GDP per Capita (USD) |
|---|---|---|---|
| 🇦🇺 Australia | 114.2 | 12.7 | 65,526 |
| 🇧🇩 Bangladesh | 25.1 | 7.4 | 2,731 |
| 🇧🇳 Brunei | 32.0 | 9.2 | 37,667 |
| 🇰🇭 Cambodia | 13.0 | 5.1 | 1,785 |
| 🇨🇦 Canada | 79.5 | 13.8 | 55,085 |
| 🇨🇱 Chile | 91.7 | 10.9 | 15,095 |
| 🇨🇳 China | 63.6 | 7.6 | 12,814 |
| 🇪🇨 Ecuador | 52.6 | 8.8 | 6,462 |
| 🇭🇰 Hong Kong | 88.4 | 12.2 | 49,226 |
| 🇮🇳 India | 31.3 | 6.7 | 2,379 |
| 🇮🇩 Indonesia | 36.3 | 8.6 | 4,798 |
| 🇯🇵 Japan | 64.6 | 13.4 | 33,822 |
| 🇱🇦 Laos | 13.0 | 5.4 | 2,047 |
| 🇲🇾 Malaysia | 42.6 | 10.6 | 12,364 |
| 🇲🇽 Mexico | 44.8 | 9.2 | 10,868 |
| 🇲🇲 Myanmar | 18.8 | 6.4 | 1,053 |
| 🇳🇿 New Zealand | 79.9 | 12.9 | 47,208 |
| 🇵🇰 Pakistan | 12.2 | 4.5 | 1,658 |
| 🇵🇪 Peru | 70.7 | 9.9 | 7,094 |
| 🇵🇭 Philippines | 35.5 | 9.0 | 3,623 |
| 🇷🇺 Russia | 86.4 | 12.8 | 15,444 |
| 🇸🇬 Singapore | 93.1 | 11.9 | 82,808 |
| 🇰🇷 South Korea | 102.5 | 12.5 | 32,250 |
| 🇱🇰 Sri Lanka | 21.6 | 10.8 | 3,362 |
| 🇹🇼 Taiwan | 89.8 | 12.3 | 32,643 |
| 🇹🇭 Thailand | 43.8 | 8.7 | 7,651 |
| 🇬🇧 United Kingdom | 69.5 | 13.4 | 45,295 |
| 🇺🇸 United States | 87.6 | 13.7 | 76,348 |
| 🇻🇳 Vietnam | 35.4 | 8.4 | 4,087 |
In most cases, the higher a country’s per capita GDP, the higher its gross enrollment ratio. Higher-income countries typically have more resources to invest in education infrastructure, teacher training, and materials.
Outliers in this dataset include Russia and Chile, which have per capita GDPs of $15,400 and $15,100 respectively. This could be due to cultural values (e.g. placing emphasis on education), or government initiatives.
Explore the Sustainable Trade Index
This infographic is a preview of the Sustainable Trade Index, which evaluates 30 major economies using 71 economic, societal, and environmental indicators. Download the free report from The Hinrich Foundation.

-

 United States22 hours ago
Visualizing the Most Common Pets in the U.S.
Lions, tigers, and bears, oh my!—these animals do not feature on this list of popular American household pets.
-

 VC+6 days ago
VC+: Get Our Key Takeaways From the IMF’s World Economic Outlook
A sneak preview of the exclusive VC+ Special Dispatch—your shortcut to understanding IMF’s World Economic Outlook report.
-

 Lithium6 days ago
Ranked: The Top 10 EV Battery Manufacturers in 2023
Asia dominates this ranking of the world’s largest EV battery manufacturers in 2023.
-

 Science1 week ago
Visualizing the Average Lifespans of Mammals
While smaller animals such as weasels typically live 1-2 years, larger counterparts can thrive for decades.
-

 Misc2 weeks ago
How Hard Is It to Get Into an Ivy League School?
We detail the admission rates and average annual cost for Ivy League schools, as well as the median SAT scores required to be accepted.
-

 Maps2 weeks ago
The Largest Earthquakes in the New York Area (1970-2024)
The earthquake that shook buildings across New York in April 2024 was the third-largest quake in the Northeast U.S. over the past 50 years.