Ranked: Resource Dependency Across 30 Major Economies


Ranked: Resource Dependency Across 30 Major Economies
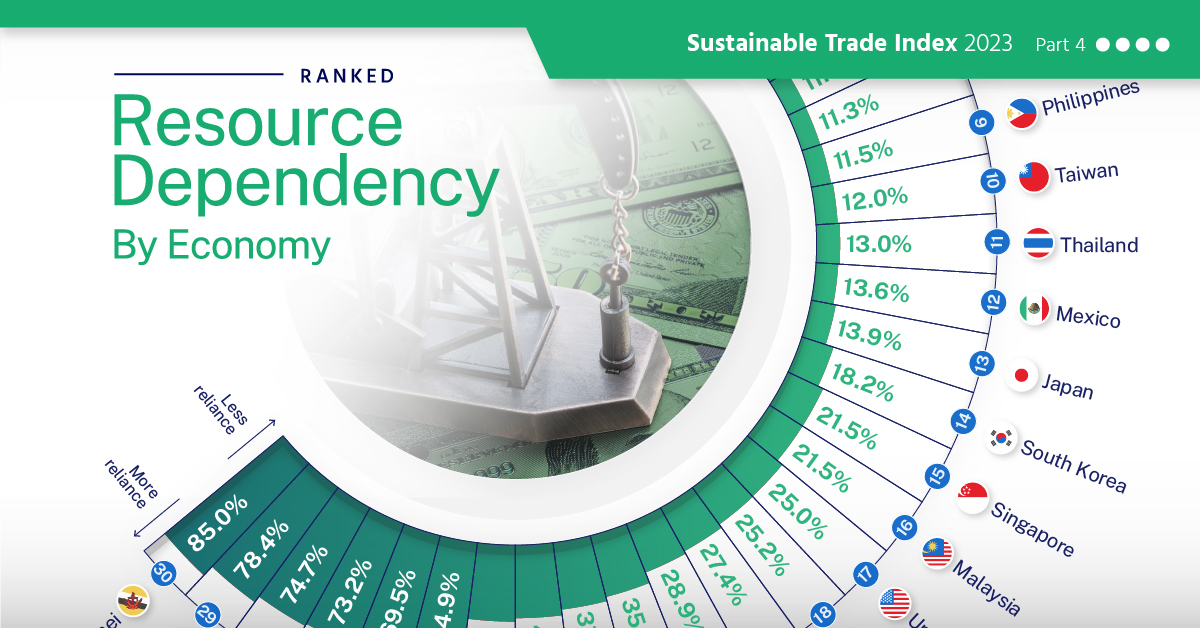
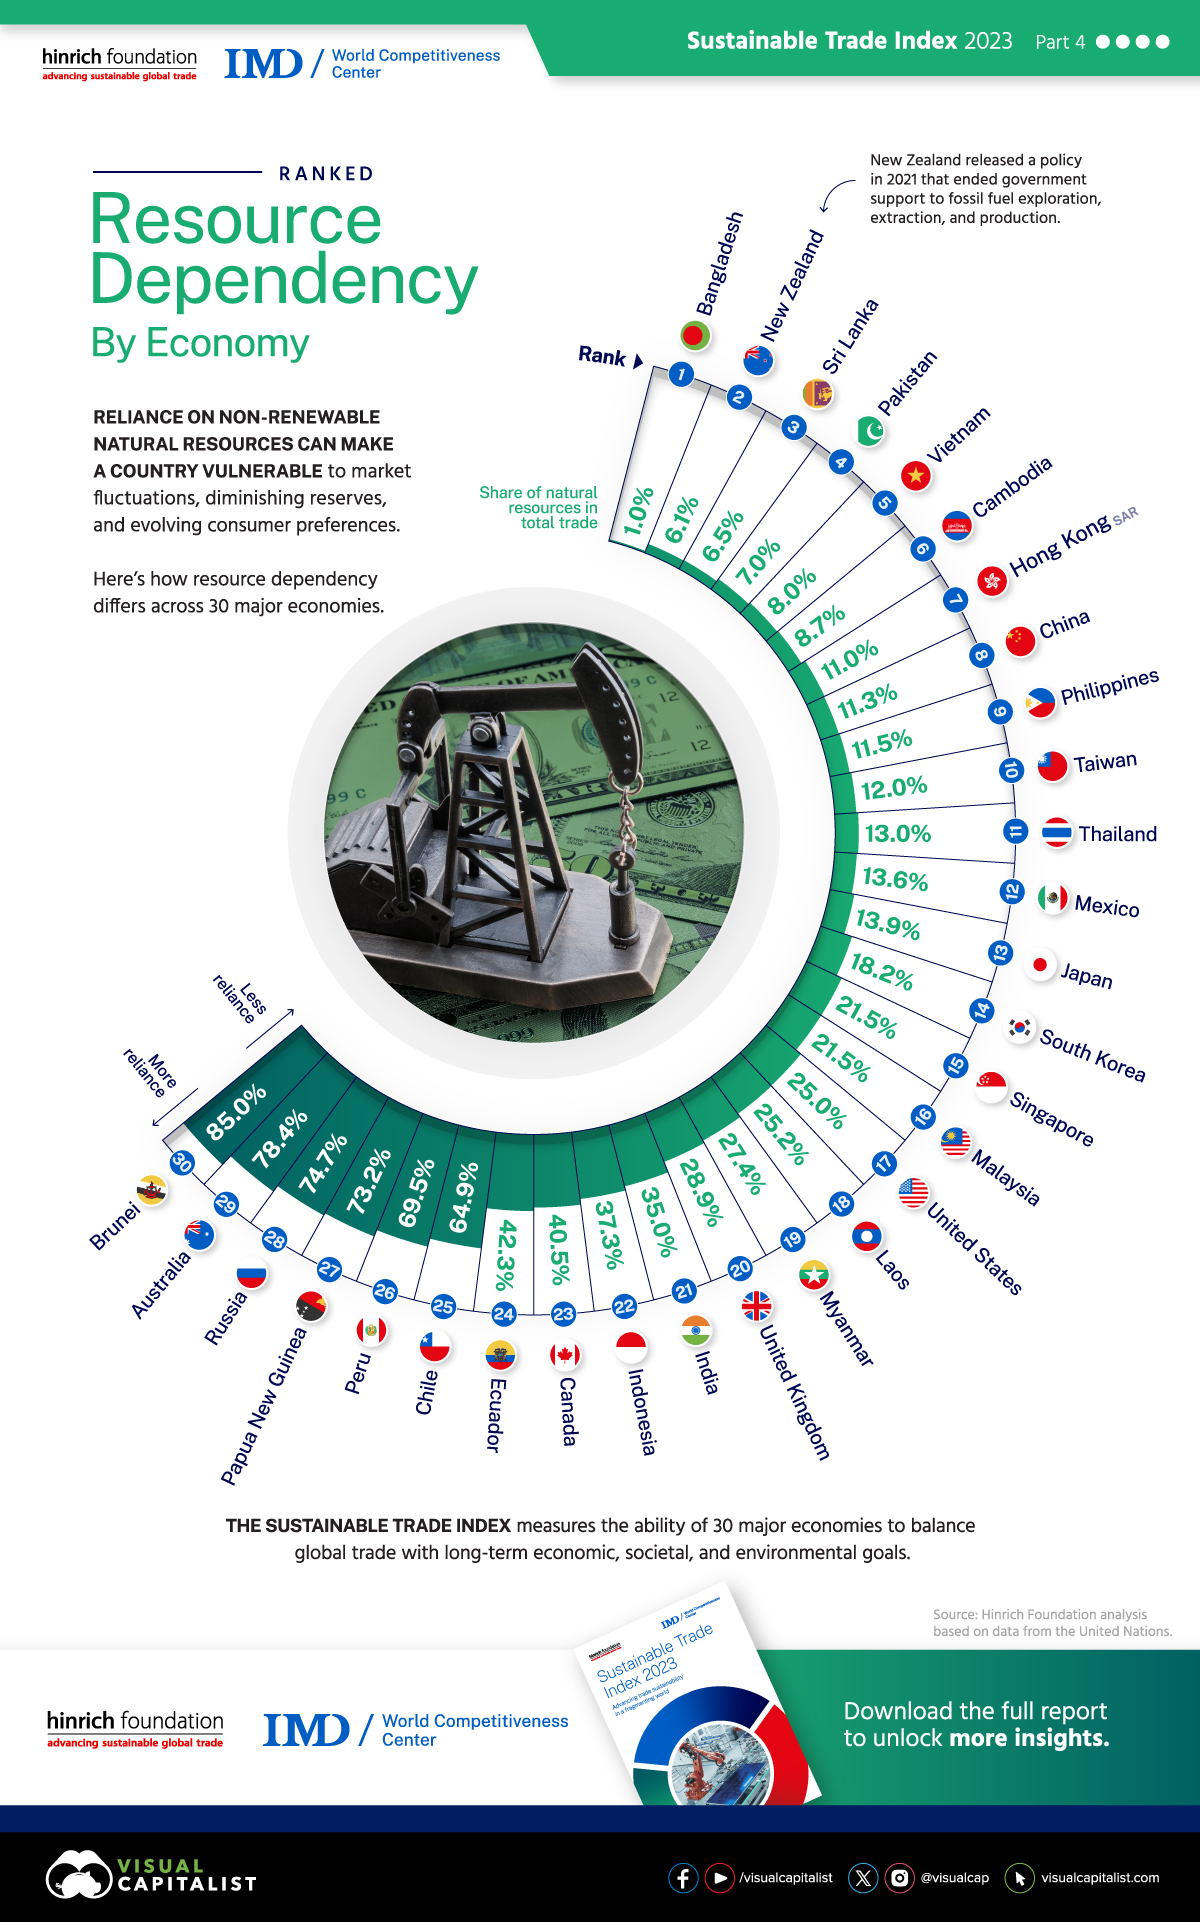
Countries that rely heavily on non-renewable natural resources are typically more susceptible to market fluctuations (e.g. oil prices), diminishing reserves, and evolving consumer preferences.
On top of this, there’s also environmental considerations such as habitat destruction, increased greenhouse gas emissions, and the long-term impacts of pollution.
To learn more, the Hinrich Foundation has ranked 30 major economies by their share of natural resources in total trade. The analysis comes from the 2023 Sustainable Trade Index (STI), which was produced by the Hinrich Foundation in collaboration with the IMD World Competitiveness Center.
Data Overview
The figures in this graphic represent each economy’s share of total trade value that is based on natural resources. This includes ores and metals, fuels, lubricants, and other related materials.
The larger the percentage, the greater the economic dependence on natural resources.
| Rank | Economy | Share of natural resources in total trade (%) |
|---|---|---|
| 1 | 🇧🇩 Bangladesh | 1.0 |
| 2 | 🇳🇿 New Zealand | 6.1 |
| 3 | 🇱🇰 Sri Lanka | 6.5 |
| 4 | 🇵🇰 Pakistan | 7.0 |
| 5 | 🇻🇳 Vietnam | 8.0 |
| 6 | 🇰🇭 Cambodia | 8.7 |
| 7 | 🇭🇰 Hong Kong, SAR | 11.0 |
| 8 | 🇨🇳 China | 11.3 |
| 9 | 🇵🇭 Philippines | 11.5 |
| 10 | 🇹🇼 Taiwan | 12.0 |
| 11 | 🇹🇭 Thailand | 13.0 |
| 12 | 🇲🇽 Mexico | 13.6 |
| 13 | 🇯🇵 Japan | 13.9 |
| 14 | 🇰🇷 South Korea | 18.2 |
| 15 | 🇸🇬 Singapore | 21.5 |
| 16 | 🇲🇾 Malaysia | 21.5 |
| 17 | 🇺🇸 United States | 25.0 |
| 18 | 🇱🇦 Laos | 25.2 |
| 19 | 🇲🇲 Myanmar | 27.4 |
| 20 | 🇬🇧 United Kingdom | 28.9 |
| 21 | 🇮🇳 India | 35.0 |
| 22 | 🇮🇩 Indonesia | 37.3 |
| 23 | 🇨🇦 Canada | 40.5 |
| 24 | 🇪🇨 Ecuador | 42.3 |
| 25 | 🇨🇱 Chile | 64.9 |
| 26 | 🇵🇪 Peru | 69.5 |
| 27 | 🇵🇬 Papua New Guinea | 73.2 |
| 28 | 🇷🇺 Russia | 74.7 |
| 29 | 🇦🇺 Australia | 78.4 |
| 30 | 🇧🇳 Brunei | 85.0 |
The three countries with the highest share of natural resources in trade are Brunei (85.0%), Australia (78.4%), and Russia (74.7%).
Exports from all three are dominated by some combination of fossil fuels and minerals. For example, Australia’s top five exports in 2020/21 were:
- Iron ore and concentrates (33.3% of total exports)
- Coal (8.5%)
- Natural gas (6.6%)
- Education-related travel services (6.0%)
- Gold (5.7%)
Russia, on the other hand, is the world’s third largest oil producer. In 2021, crude and refined petroleum represented 40.2% of the country’s exports.
To ensure long-term stability, it is important for economies dependent on natural resource trade to diversify their exports, invest in sustainable technologies, and develop sectors resilient to global market fluctuations.
Explore the Sustainable Trade Index
This infographic is a preview of the Sustainable Trade Index, which evaluates 30 major economies using 71 economic, societal, and environmental indicators. Download the free report from the Hinrich Foundation

-

 Green2 days ago
The Carbon Footprint of Major Travel Methods
Going on a cruise ship and flying domestically are the most carbon-intensive travel methods.
-

 Green2 weeks ago
Ranking the Top 15 Countries by Carbon Tax Revenue
This graphic highlights France and Canada as the global leaders when it comes to generating carbon tax revenue.
-

 Green2 weeks ago
Ranked: The Countries With the Most Air Pollution in 2023
South Asian nations are the global hotspot for pollution. In this graphic, we rank the world’s most polluted countries according to IQAir.
-

 Green2 weeks ago
Top Countries By Forest Growth Since 2001
One country is taking reforestation very seriously, registering more than 400,000 square km of forest growth in two decades.
-

 Green3 weeks ago
Ranked: Top Countries by Total Forest Loss Since 2001
The country with the most forest loss since 2001 lost as much forest cover as the next four countries combined.
-

 Agriculture2 months ago
The World’s Top Cocoa Producing Countries
Here are the largest cocoa producing countries globally—from Côte d’Ivoire to Brazil—as cocoa prices hit record highs.