Economy
Mapped: Unemployment Claims by State
![]() See this visualization first on the Voronoi app.
See this visualization first on the Voronoi app.
Mapped: Weekly Unemployment Claims by State
This was originally posted on our Voronoi app. Download the app for free on iOS or Android and discover incredible data-driven charts from a variety of trusted sources.
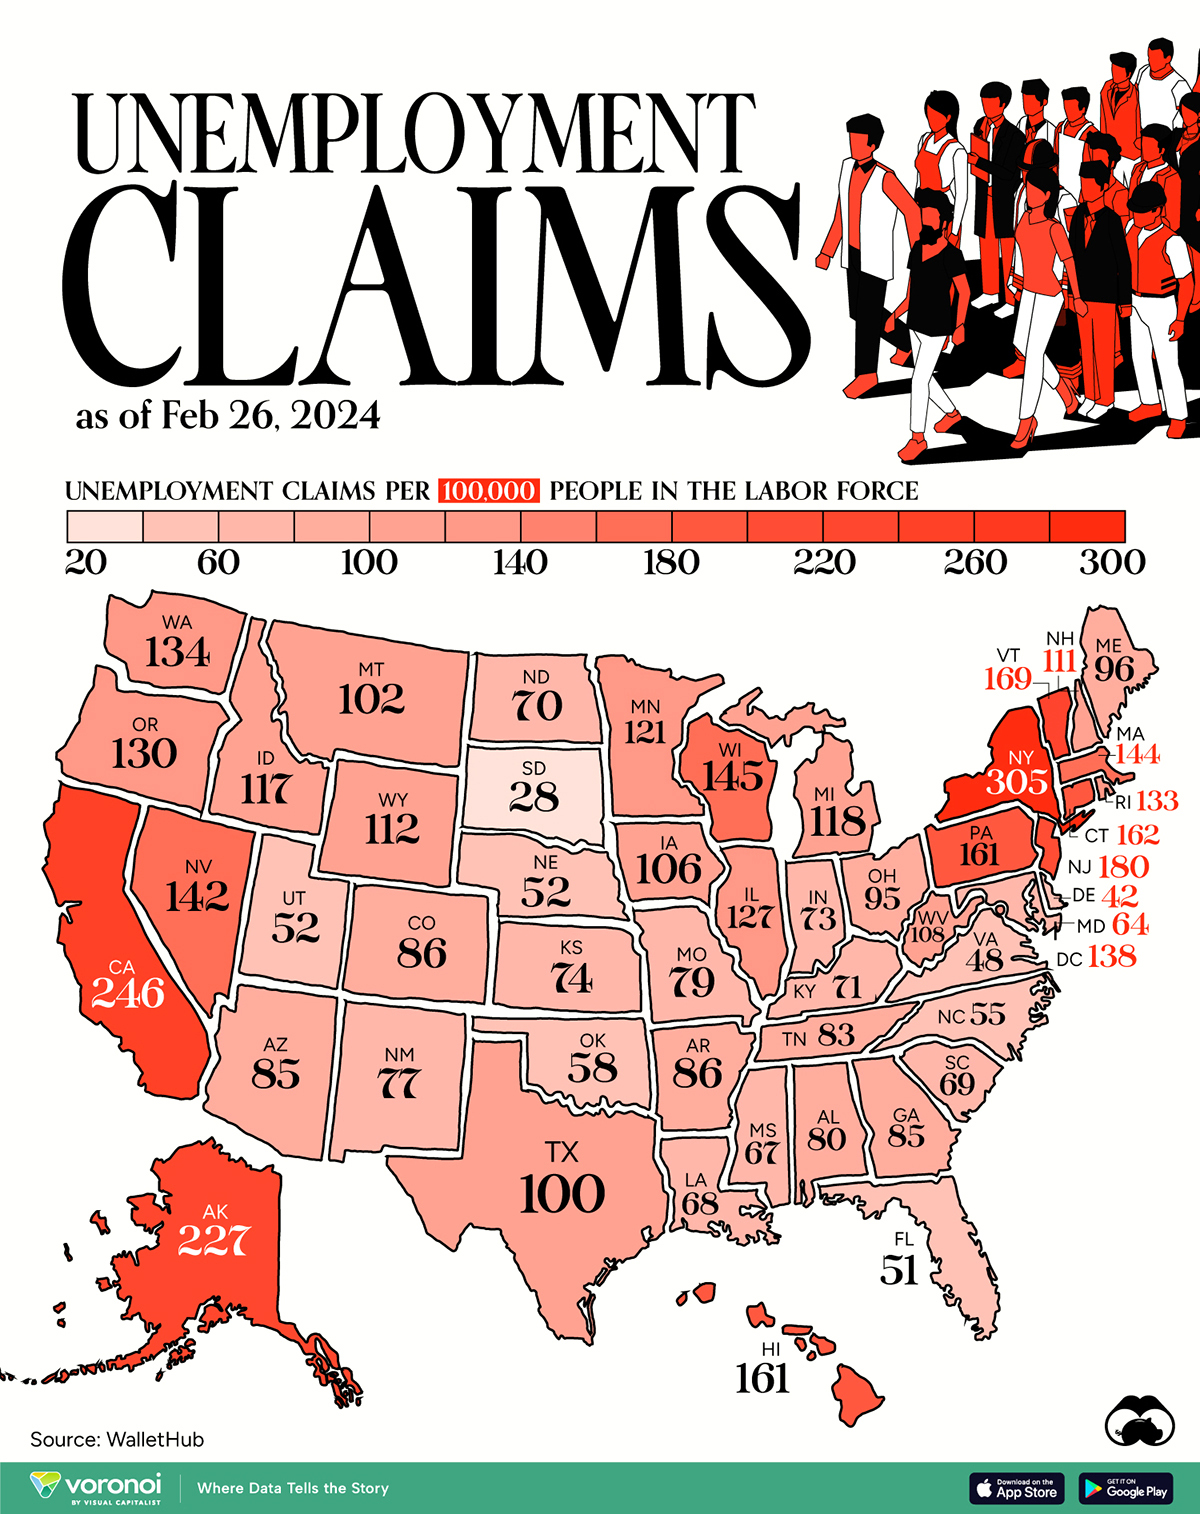
Unemployment claims per 100,000 people is a handy metric for gauging the health of the job market. Generally speaking, a higher number of claims suggests that more people are unemployed, which may highlight issues with the economy.
In this graphic, we’ve visualized the number of weekly initial unemployment claims per 100,000 people in the labor force across the U.S., using data from WalletHub. All figures are for the week ending Feb 26, 2024, with data being released in early March.
| State | Unemployment Claims per 100,000 People in the Labor Force |
|---|---|
| New York | 305 |
| California | 246 |
| Alaska | 227 |
| New Jersey | 180 |
| Vermont | 169 |
| Connecticut | 162 |
| Pennsylvania | 161 |
| Hawaii | 161 |
| Wisconsin | 145 |
| Massachusetts | 144 |
| Nevada | 142 |
| DC | 138 |
| Washington | 134 |
| Rhode Island | 133 |
| Oregon | 130 |
| Illinois | 127 |
| Minnesota | 121 |
| Michigan | 118 |
| Idaho | 117 |
| Wyoming | 112 |
| New Hampshire | 111 |
| West Virginia | 108 |
| Iowa | 106 |
| Montana | 102 |
| Texas | 100 |
| Maine | 96 |
| Ohio | 95 |
| Colorado | 86 |
| Arkansas | 86 |
| Arizona | 85 |
| Georgia | 85 |
| Tennessee | 83 |
| Alabama | 80 |
| Missouri | 79 |
| New Mexico | 77 |
| Kansas | 74 |
| Indiana | 73 |
| Kentucky | 71 |
| North Dakota | 70 |
| South Carolina | 69 |
| Louisiana | 68 |
| Mississippi | 67 |
| Maryland | 64 |
| Oklahoma | 58 |
| North Carolina | 55 |
| Nebraska | 52 |
| Utah | 52 |
| Florida | 51 |
| Virginia | 48 |
| Delaware | 42 |
| South Dakota | 28 |
Across the country, there are 6.1 million Americans unemployed as of end of February, resulting in a national unemployment rate of around 3.9%. Notably, this is the highest figure seen since January 2022.
States With the Largest Increases
For further context, we can examine the change in unemployment claims by state for the period of Jan 1- Feb 26, in 2024 and 2023.
States that saw the biggest rise over this period were New York, New Jersey, and Nevada. A top 10 list can be found below.
| State | Change in Unemployment Claims (Jan-Feb, 2023 vs 2024) |
|---|---|
| New York | 2,725% |
| New Jersey | 2,132% |
| Nevada | 505% |
| Arizona | 51% |
| Iowa | 45% |
| Maryland | 35% |
| North Carolina | 34% |
| Virginia | 31% |
| Montana | 25% |
| Oklahoma | 24% |
From a broader perspective, weekly initial claims for unemployment insurance across the U.S. have hovered around the low 200,000s in 2024. This is generally in line with figures seen prior to the COVID-19 pandemic.
In the week of April 4, 2020, unemployment claims spiked to 6.137 million due to COVID-related lockdowns and business closures.
Learn More About the U.S Job Market
Before you go, be sure to check out Visualizing the American Workforce as 100 People to gain a unique perspective on the U.S. economy.


Economy
Economic Growth Forecasts for G7 and BRICS Countries in 2024
The IMF has released its economic growth forecasts for 2024. How do the G7 and BRICS countries compare?


G7 & BRICS Real GDP Growth Forecasts for 2024
The International Monetary Fund’s (IMF) has released its real gross domestic product (GDP) growth forecasts for 2024, and while global growth is projected to stay steady at 3.2%, various major nations are seeing declining forecasts.
This chart visualizes the 2024 real GDP growth forecasts using data from the IMF’s 2024 World Economic Outlook for G7 and BRICS member nations along with Saudi Arabia, which is still considering an invitation to join the bloc.
Get the Key Insights of the IMF’s World Economic Outlook
Want a visual breakdown of the insights from the IMF’s 2024 World Economic Outlook report?
This visual is part of a special dispatch of the key takeaways exclusively for VC+ members.
Get the full dispatch of charts by signing up to VC+.
Mixed Economic Growth Prospects for Major Nations in 2024
Economic growth projections by the IMF for major nations are mixed, with the majority of G7 and BRICS countries forecasted to have slower growth in 2024 compared to 2023.
Only three BRICS-invited or member countries, Saudi Arabia, the UAE, and South Africa, have higher projected real GDP growth rates in 2024 than last year.
| Group | Country | Real GDP Growth (2023) | Real GDP Growth (2024P) |
|---|---|---|---|
| G7 | 🇺🇸 U.S. | 2.5% | 2.7% |
| G7 | 🇨🇦 Canada | 1.1% | 1.2% |
| G7 | 🇯🇵 Japan | 1.9% | 0.9% |
| G7 | 🇫🇷 France | 0.9% | 0.7% |
| G7 | 🇮🇹 Italy | 0.9% | 0.7% |
| G7 | 🇬🇧 UK | 0.1% | 0.5% |
| G7 | 🇩🇪 Germany | -0.3% | 0.2% |
| BRICS | 🇮🇳 India | 7.8% | 6.8% |
| BRICS | 🇨🇳 China | 5.2% | 4.6% |
| BRICS | 🇦🇪 UAE | 3.4% | 3.5% |
| BRICS | 🇮🇷 Iran | 4.7% | 3.3% |
| BRICS | 🇷🇺 Russia | 3.6% | 3.2% |
| BRICS | 🇪🇬 Egypt | 3.8% | 3.0% |
| BRICS-invited | 🇸🇦 Saudi Arabia | -0.8% | 2.6% |
| BRICS | 🇧🇷 Brazil | 2.9% | 2.2% |
| BRICS | 🇿🇦 South Africa | 0.6% | 0.9% |
| BRICS | 🇪🇹 Ethiopia | 7.2% | 6.2% |
| 🌍 World | 3.2% | 3.2% |
China and India are forecasted to maintain relatively high growth rates in 2024 at 4.6% and 6.8% respectively, but compared to the previous year, China is growing 0.6 percentage points slower while India is an entire percentage point slower.
On the other hand, four G7 nations are set to grow faster than last year, which includes Germany making its comeback from its negative real GDP growth of -0.3% in 2023.
Faster Growth for BRICS than G7 Nations
Despite mostly lower growth forecasts in 2024 compared to 2023, BRICS nations still have a significantly higher average growth forecast at 3.6% compared to the G7 average of 1%.
While the G7 countries’ combined GDP is around $15 trillion greater than the BRICS nations, with continued higher growth rates and the potential to add more members, BRICS looks likely to overtake the G7 in economic size within two decades.
BRICS Expansion Stutters Before October 2024 Summit
BRICS’ recent expansion has stuttered slightly, as Argentina’s newly-elected president Javier Milei declined its invitation and Saudi Arabia clarified that the country is still considering its invitation and has not joined BRICS yet.
Even with these initial growing pains, South Africa’s Foreign Minister Naledi Pandor told reporters in February that 34 different countries have submitted applications to join the growing BRICS bloc.
Any changes to the group are likely to be announced leading up to or at the 2024 BRICS summit which takes place October 22-24 in Kazan, Russia.
Get the Full Analysis of the IMF’s Outlook on VC+
This visual is part of an exclusive special dispatch for VC+ members which breaks down the key takeaways from the IMF’s 2024 World Economic Outlook.
For the full set of charts and analysis, sign up for VC+.

-

 Misc1 week ago
How Hard Is It to Get Into an Ivy League School?
-

 Technology2 weeks ago
Ranked: Semiconductor Companies by Industry Revenue Share
-

 Markets2 weeks ago
Ranked: The World’s Top Flight Routes, by Revenue
-

 Countries2 weeks ago
Population Projections: The World’s 6 Largest Countries in 2075
-

 Markets2 weeks ago
The Top 10 States by Real GDP Growth in 2023
-

 Demographics2 weeks ago
The Smallest Gender Wage Gaps in OECD Countries
-

 United States2 weeks ago
Where U.S. Inflation Hit the Hardest in March 2024
-

 Green2 weeks ago
Top Countries By Forest Growth Since 2001