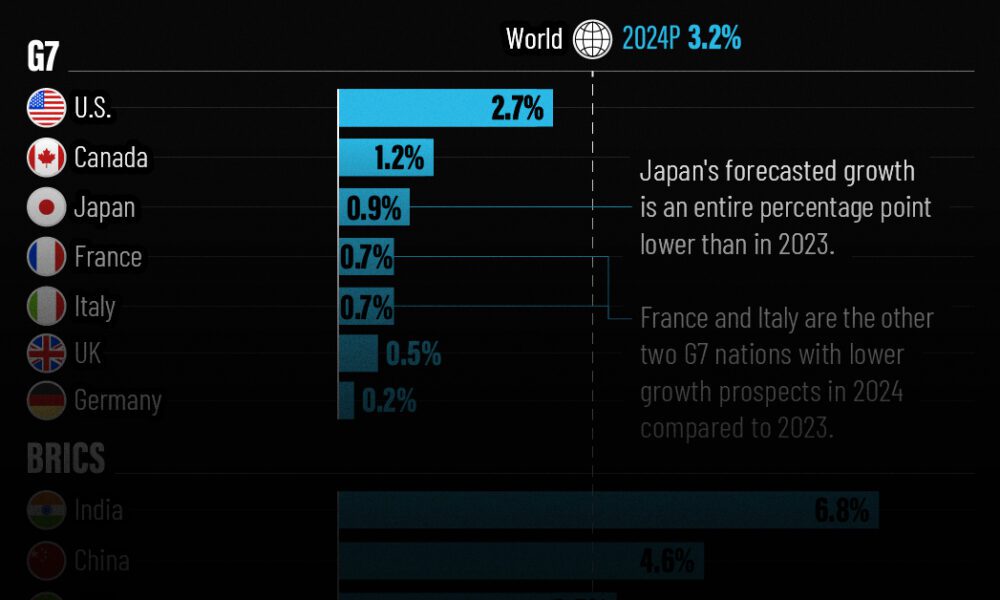
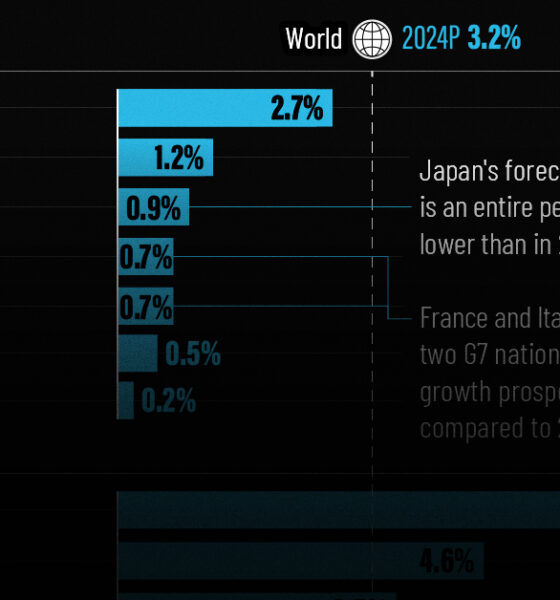
The IMF has released its economic growth forecasts for 2024. How do the G7 and BRICS countries compare?
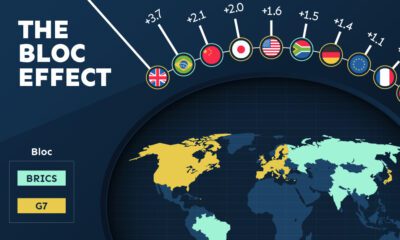

Rising geopolitical tensions are shaping the future of international trade, but what is the effect on trading among G7 and BRICS countries?


Older, better-educated adults are winning the savings game, reveals a January survey by the National Opinion Research Center at the University of Chicago.


This graphic shows why brass rods are the secure choice for precision-machined and forged parts.


We visualized the top U.S. companies by employees, revealing the massive scale of retailers like Walmart, Target, and Home Depot.


We visualized product categories that saw the highest % increase in price due to U.S. inflation as of March 2024.


From airbags to firefighting equipment, components made from brass rods play a vital role in creating a safer environment.


We visualize inflation rates across G20 countries as of Feb 2024, in the context of their COVID-19 pandemic peak.


This visual heatmap of unemployment claims by state highlights New York, California, and Alaska leading the country by a wide margin.


Will the global economy be stronger in 2024 than in 2023?


