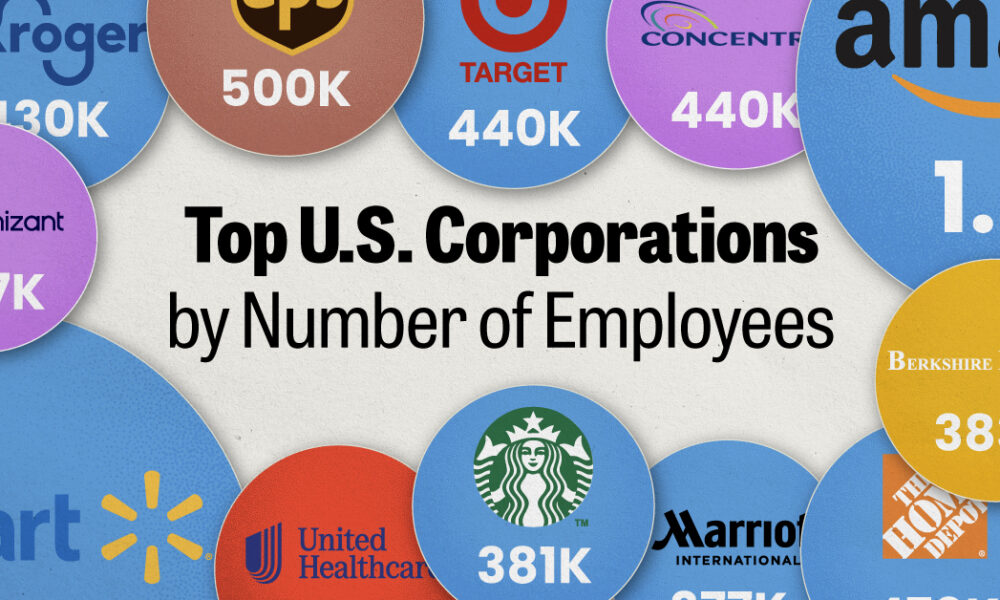

We visualized the top U.S. companies by employees, revealing the massive scale of retailers like Walmart, Target, and Home Depot.
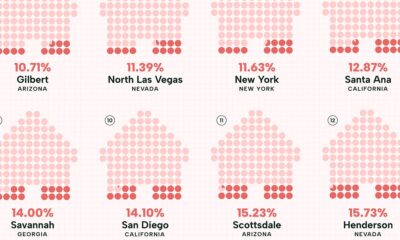

Visualizing the least affordable U.S. cities for renters by the percentage of affordable rentals available on an average salary.


This graphic illustrates Panama Canal traffic by shipment category, looking at the total number of shipping crossings and the total tonnage.
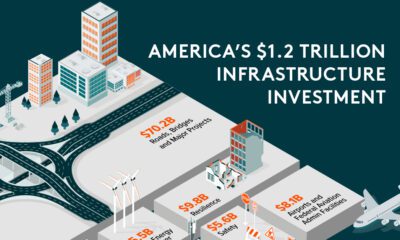

Graphic showing U.S. infrastructure investment highlighting that investment is primarily going to roads, bridges, and other major projects.
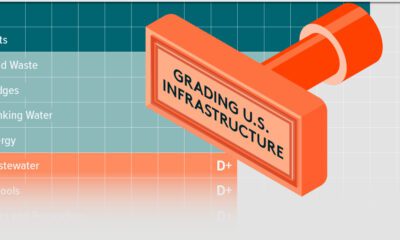

This graphic shows U.S infrastructure grades and highlights the general low grade.
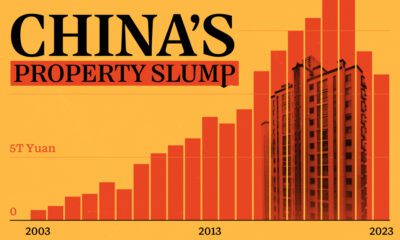

These charts show China's real estate boom in the 21st century and the subsequent slowdown since 2022.
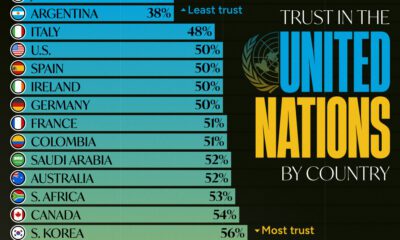

Which countries trust the United Nations to do the right thing the most, and the least?


The U.S. might have a median age of 39, but the median age by state ranges from the low 30s to the mid 40s.


China holds the position of both the top importer and exporter with MENA countries by volume.


From someone born in the 19th century, in the midst of historic population growth, comes this vintage visualization showing world cities growing ever bigger.


Today, China dominates the trade market, accounting for almost 15% of all merchandise.


 Creator Program