Economy
G20 Inflation Rates: Feb 2024 vs COVID Peak
![]() See this visualization first on the Voronoi app.
See this visualization first on the Voronoi app.
How Far Have Inflation Rates Fallen Across the G20?
This was originally posted on our Voronoi app. Download the app for free on iOS or Android and discover incredible data-driven charts from a variety of trusted sources.
A major economic consequence that arose in the aftermath of the COVID-19 pandemic was high inflation. In many countries, inflation rates reached double-digits, which is significantly higher than the 2-3% typically targeted by central banks.
Generally speaking, an extended period of fast rising prices is not optimal because it erodes the purchasing power of money. This makes everyday essentials like groceries, rent, and gas more expensive.
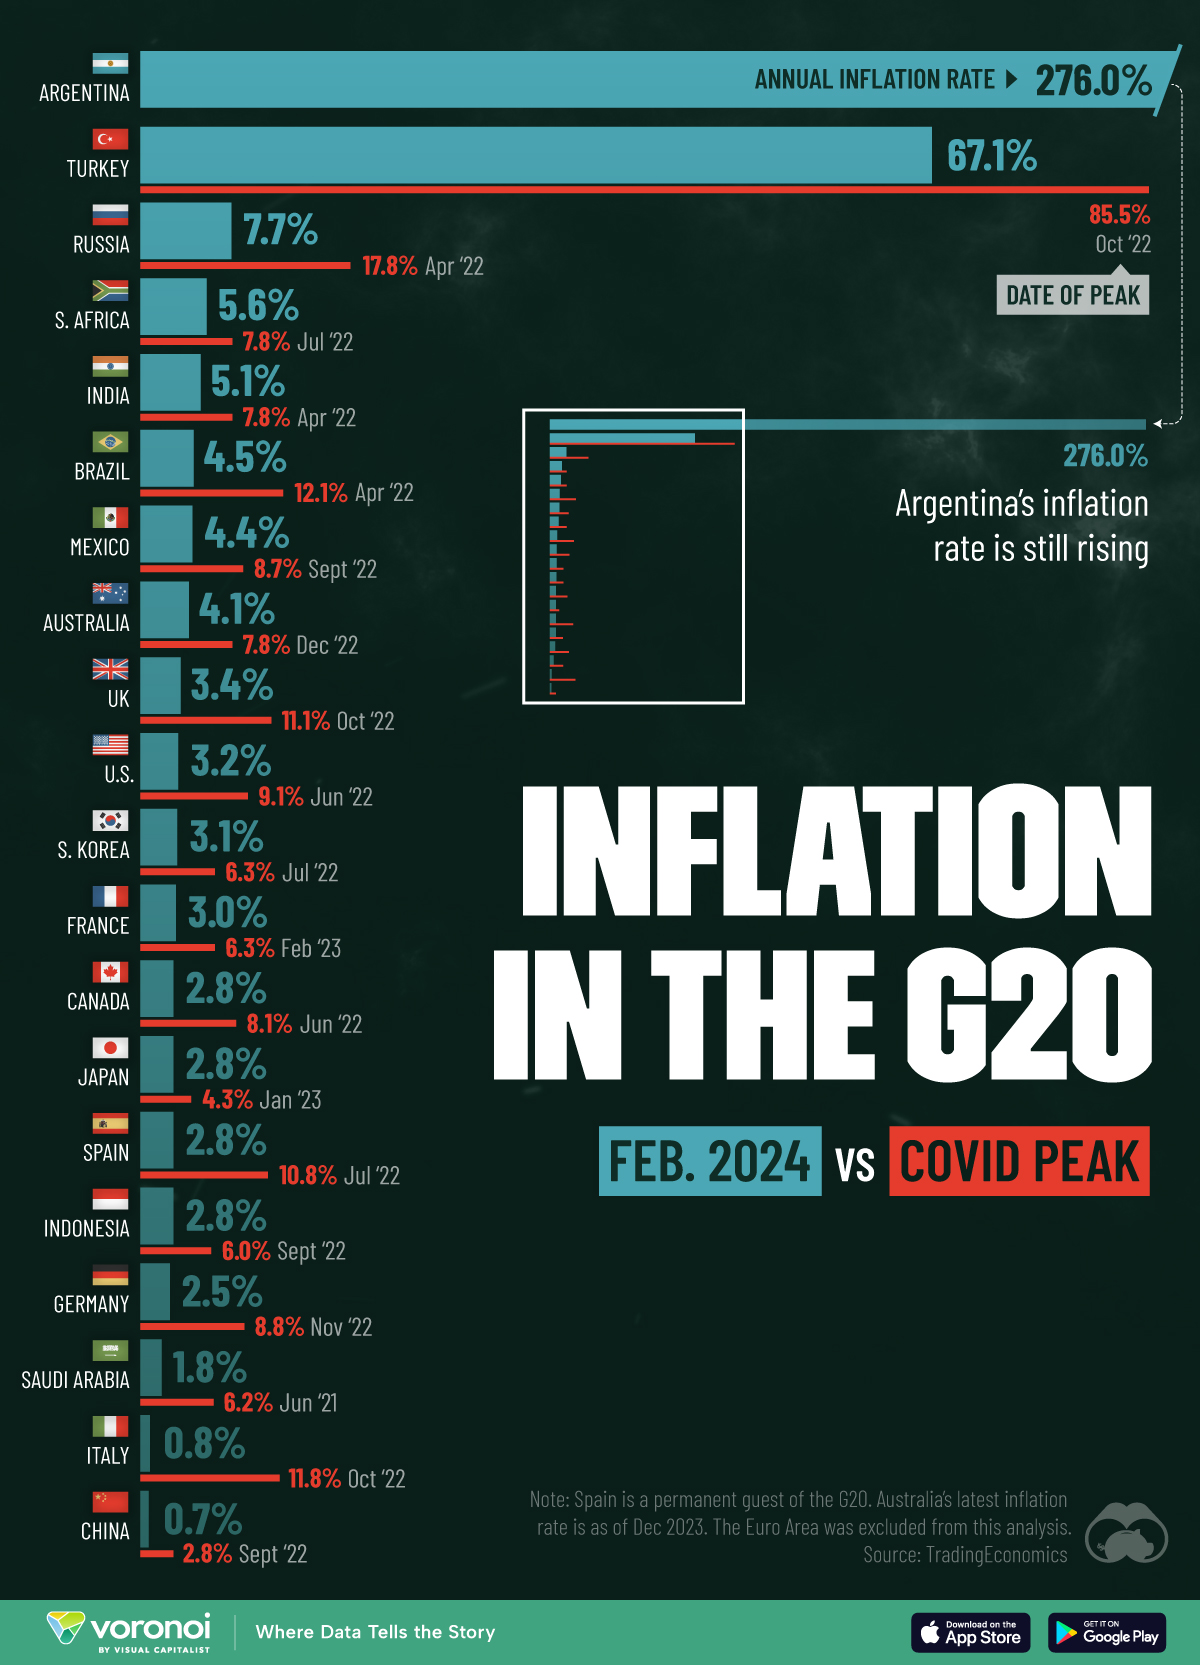
To see how inflation is currently faring, we’ve visualized annual inflation rates across G20 countries as of February 2024, in the context of their pandemic peak. This data was sourced from Trading Economics and can also be found in the table below.
| Country | Inflation (%, Feb 2024) | Inflation (%, COVID peak) | Date of Peak |
|---|---|---|---|
| 🇦🇷 Argentina | 276.0 | -- | -- |
| 🇹🇷 Turkey | 67.1 | 85.5 | Oct 2022 |
| 🇷🇺 Russia | 7.7 | 17.8 | Apr 2022 |
| 🇿🇦 South Africa | 5.6 | 7.8 | Jul 2022 |
| 🇮🇳 India | 5.1 | 7.8 | Apr 2022 |
| 🇧🇷 Brazil | 4.5 | 12.1 | Apr 2022 |
| 🇲🇽 Mexico | 4.4 | 8.7 | Sept 2022 |
| 🇦🇺 Australia | 4.1 | 7.8 | Dec 2022 |
| 🇬🇧 United Kingdom | 3.4 | 11.1 | Oct 2022 |
| 🇺🇸 United States | 3.2 | 9.1 | Jun 2022 |
| 🇰🇷 South Korea | 3.1 | 6.3 | Jul 2022 |
| 🇫🇷 France | 3.0 | 6.3 | Feb 2023 |
| 🇨🇦 Canada | 2.8 | 8.1 | Jun 2022 |
| 🇯🇵 Japan | 2.8 | 4.3 | Jan 2023 |
| 🇪🇸 Spain | 2.8 | 10.8 | Jul 2022 |
| 🇮🇩 Indonesia | 2.8 | 6 | Sept 2022 |
| 🇩🇪 Germany | 2.5 | 8.8 | Nov 2022 |
| 🇸🇦 Saudi Arabia | 1.8 | 6.2 | Jun 2021 |
| 🇮🇹 Italy | 0.8 | 11.8 | Oct 2022 |
| 🇨🇳 China | 0.7 | 2.8 | Sept 2022 |
Notes: Spain is a permanent guest of the G20. Australia’s latest inflation rate is as of Dec 2023.
Unlike other G20 nations, Argentina’s inflation rate has only gone up since the pandemic ended. This is largely due to the country’s history of printing money to compensate for government overspending.
One area hit particularly hard is food prices. According to a local consultancy, the price of beef to consumers rose by 40% to 70% between July to August 2023.
Learn More About Inflation in 2024
If you want to see more graphics on inflation, check out this global map that visualizes inflation forecasts for every country in 2024.


Economy
Economic Growth Forecasts for G7 and BRICS Countries in 2024
The IMF has released its economic growth forecasts for 2024. How do the G7 and BRICS countries compare?


G7 & BRICS Real GDP Growth Forecasts for 2024
The International Monetary Fund’s (IMF) has released its real gross domestic product (GDP) growth forecasts for 2024, and while global growth is projected to stay steady at 3.2%, various major nations are seeing declining forecasts.
This chart visualizes the 2024 real GDP growth forecasts using data from the IMF’s 2024 World Economic Outlook for G7 and BRICS member nations along with Saudi Arabia, which is still considering an invitation to join the bloc.
Get the Key Insights of the IMF’s World Economic Outlook
Want a visual breakdown of the insights from the IMF’s 2024 World Economic Outlook report?
This visual is part of a special dispatch of the key takeaways exclusively for VC+ members.
Get the full dispatch of charts by signing up to VC+.
Mixed Economic Growth Prospects for Major Nations in 2024
Economic growth projections by the IMF for major nations are mixed, with the majority of G7 and BRICS countries forecasted to have slower growth in 2024 compared to 2023.
Only three BRICS-invited or member countries, Saudi Arabia, the UAE, and South Africa, have higher projected real GDP growth rates in 2024 than last year.
| Group | Country | Real GDP Growth (2023) | Real GDP Growth (2024P) |
|---|---|---|---|
| G7 | 🇺🇸 U.S. | 2.5% | 2.7% |
| G7 | 🇨🇦 Canada | 1.1% | 1.2% |
| G7 | 🇯🇵 Japan | 1.9% | 0.9% |
| G7 | 🇫🇷 France | 0.9% | 0.7% |
| G7 | 🇮🇹 Italy | 0.9% | 0.7% |
| G7 | 🇬🇧 UK | 0.1% | 0.5% |
| G7 | 🇩🇪 Germany | -0.3% | 0.2% |
| BRICS | 🇮🇳 India | 7.8% | 6.8% |
| BRICS | 🇨🇳 China | 5.2% | 4.6% |
| BRICS | 🇦🇪 UAE | 3.4% | 3.5% |
| BRICS | 🇮🇷 Iran | 4.7% | 3.3% |
| BRICS | 🇷🇺 Russia | 3.6% | 3.2% |
| BRICS | 🇪🇬 Egypt | 3.8% | 3.0% |
| BRICS-invited | 🇸🇦 Saudi Arabia | -0.8% | 2.6% |
| BRICS | 🇧🇷 Brazil | 2.9% | 2.2% |
| BRICS | 🇿🇦 South Africa | 0.6% | 0.9% |
| BRICS | 🇪🇹 Ethiopia | 7.2% | 6.2% |
| 🌍 World | 3.2% | 3.2% |
China and India are forecasted to maintain relatively high growth rates in 2024 at 4.6% and 6.8% respectively, but compared to the previous year, China is growing 0.6 percentage points slower while India is an entire percentage point slower.
On the other hand, four G7 nations are set to grow faster than last year, which includes Germany making its comeback from its negative real GDP growth of -0.3% in 2023.
Faster Growth for BRICS than G7 Nations
Despite mostly lower growth forecasts in 2024 compared to 2023, BRICS nations still have a significantly higher average growth forecast at 3.6% compared to the G7 average of 1%.
While the G7 countries’ combined GDP is around $15 trillion greater than the BRICS nations, with continued higher growth rates and the potential to add more members, BRICS looks likely to overtake the G7 in economic size within two decades.
BRICS Expansion Stutters Before October 2024 Summit
BRICS’ recent expansion has stuttered slightly, as Argentina’s newly-elected president Javier Milei declined its invitation and Saudi Arabia clarified that the country is still considering its invitation and has not joined BRICS yet.
Even with these initial growing pains, South Africa’s Foreign Minister Naledi Pandor told reporters in February that 34 different countries have submitted applications to join the growing BRICS bloc.
Any changes to the group are likely to be announced leading up to or at the 2024 BRICS summit which takes place October 22-24 in Kazan, Russia.
Get the Full Analysis of the IMF’s Outlook on VC+
This visual is part of an exclusive special dispatch for VC+ members which breaks down the key takeaways from the IMF’s 2024 World Economic Outlook.
For the full set of charts and analysis, sign up for VC+.

-

 Debt1 week ago
How Debt-to-GDP Ratios Have Changed Since 2000
-

 Markets2 weeks ago
Ranked: The World’s Top Flight Routes, by Revenue
-

 Demographics2 weeks ago
Population Projections: The World’s 6 Largest Countries in 2075
-

 Markets2 weeks ago
The Top 10 States by Real GDP Growth in 2023
-

 Demographics2 weeks ago
The Smallest Gender Wage Gaps in OECD Countries
-

 Economy2 weeks ago
Where U.S. Inflation Hit the Hardest in March 2024
-

 Green2 weeks ago
Top Countries By Forest Growth Since 2001
-

 United States2 weeks ago
Ranked: The Largest U.S. Corporations by Number of Employees