Markets
Mapped: Inflation Projections by Country, in 2024
![]() See this visualization first on the Voronoi app.
See this visualization first on the Voronoi app.
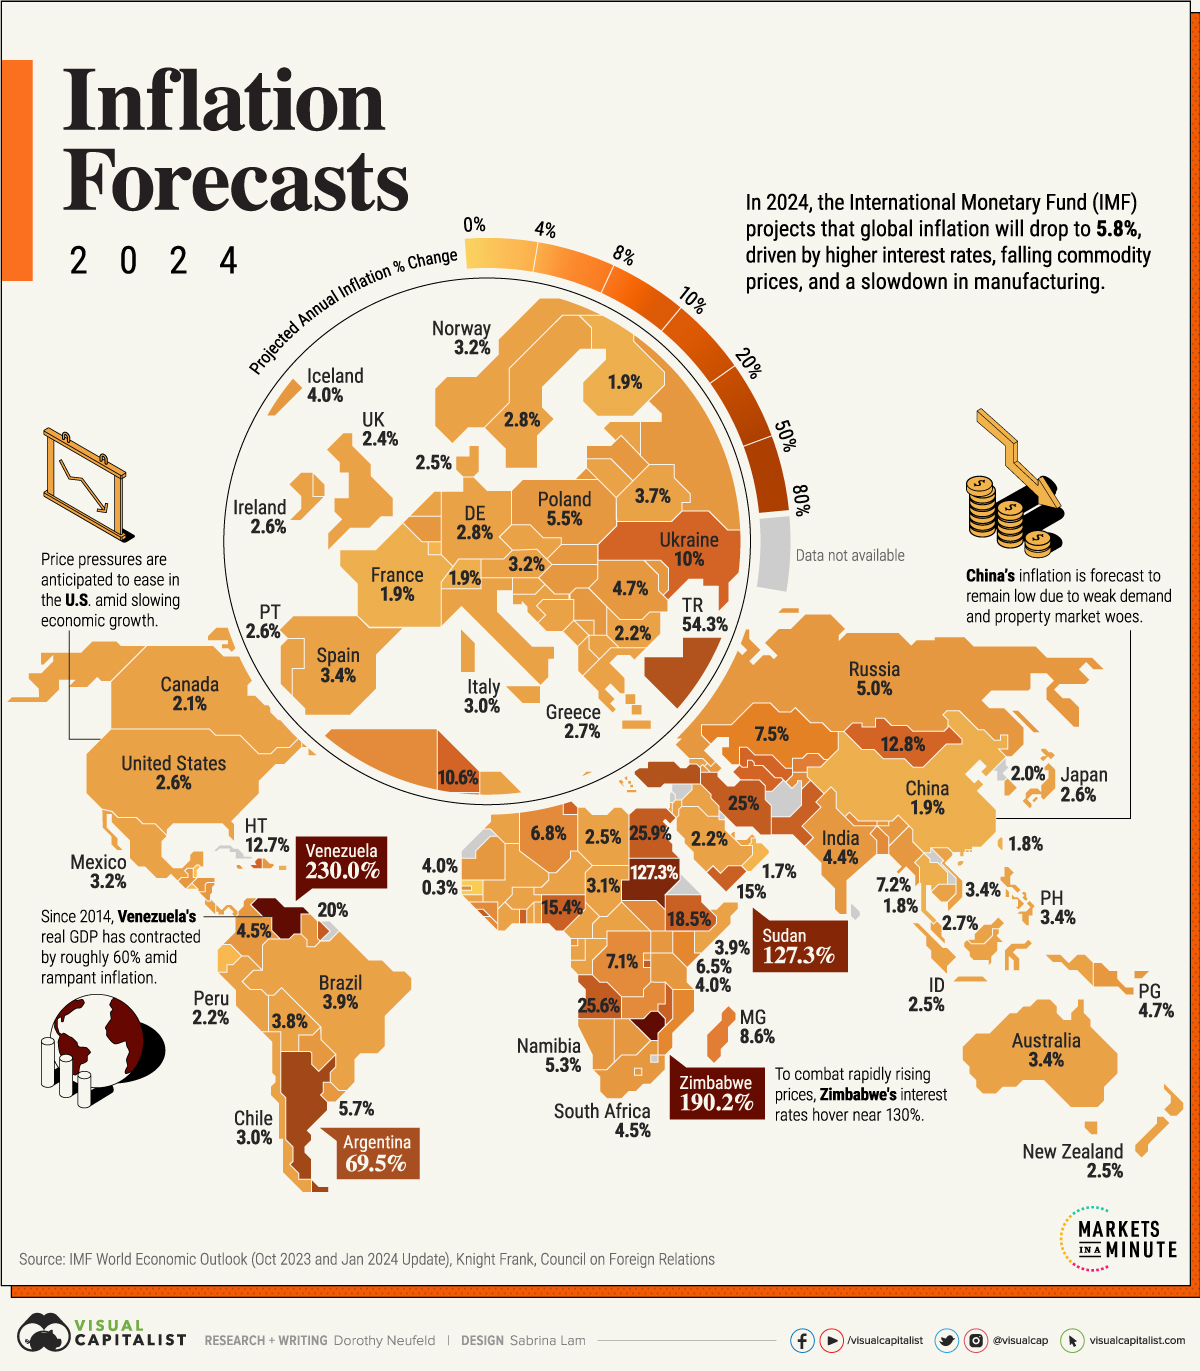
Inflation Projections, by Country in 2024
This was originally posted on our Voronoi app. Download the app for free on iOS or Android and discover incredible data-driven charts from a variety of trusted sources.
Global economic prospects hang on a delicate balance, largely hinging on the path of inflation.
While inflation looks to be easing, there remains the risk of a second wave of price pressures driven by geopolitical conflicts and supply disruptions in the Red Sea. Adding to this, a stronger than expected labor market could drive consumer demand, pushing up higher prices.
This graphic shows 2024 inflation projections around the world, based on forecasts from the International Monetary Fund (IMF).
Is Global Inflation On a Downward Path?
In 2024, global inflation is projected to decline to 5.8%, down from a 6.8% estimated annual average in 2023.
Tighter monetary policy and falling energy prices are forecast to dampen price pressures alongside a cooling labor market. Below, we show inflation projections across 190 countries:
| Country | Projected Annual Inflation Change 2024 |
|---|---|
| 🇻🇪 Venezuela | 230.0% |
| 🇿🇼 Zimbabwe | 190.2% |
| 🇸🇩 Sudan | 127.3% |
| 🇦🇷 Argentina | 69.5% |
| 🇹🇷 Türkiye | 54.3% |
| 🇪🇬 Egypt | 25.9% |
| 🇦🇴 Angola | 25.6% |
| 🇮🇷 Iran | 25.0% |
| 🇧🇮 Burundi | 22.4% |
| 🇸🇱 Sierra Leone | 21.7% |
| 🇸🇷 Suriname | 20.0% |
| 🇪🇹 Ethiopia | 18.5% |
| 🇵🇰 Pakistan | 17.5% |
| 🇳🇬 Nigeria | 15.4% |
| 🇲🇼 Malawi | 15.2% |
| 🇬🇭 Ghana | 15.0% |
| 🇾🇪 Yemen | 15.0% |
| 🇲🇳 Mongolia | 12.8% |
| 🇭🇹 Haiti | 12.7% |
| 🇺🇿 Uzbekistan | 10.7% |
| 🇹🇳 Tunisia | 10.6% |
| 🇹🇲 Turkmenistan | 10.0% |
| 🇺🇦 Ukraine | 10.0% |
| 🇲🇬 Madagascar | 8.6% |
| 🇰🇬 Kyrgyz Republic | 8.0% |
| 🇿🇲 Zambia | 7.9% |
| 🇲🇺 Mauritius | 7.8% |
| 🇬🇳 Guinea | 7.8% |
| 🇰🇿 Kazakhstan | 7.5% |
| 🇧🇩 Bangladesh | 7.2% |
| 🇲🇲 Myanmar | 7.2% |
| 🇸🇹 São Tomé and Príncipe | 7.2% |
| 🇬🇲 The Gambia | 7.1% |
| 🇨🇩 Democratic Republic of the Congo | 7.1% |
| 🇩🇿 Algeria | 6.8% |
| 🇹🇯 Tajikistan | 6.5% |
| 🇳🇵 Nepal | 6.5% |
| 🇰🇪 Kenya | 6.5% |
| 🇲🇿 Mozambique | 6.5% |
| 🇹🇴 Tonga | 6.2% |
| 🇸🇸 South Sudan | 6.1% |
| 🇱🇷 Liberia | 6.0% |
| 🇺🇾 Uruguay | 5.7% |
| 🇻🇺 Vanuatu | 5.6% |
| 🇵🇱 Poland | 5.5% |
| 🇬🇾 Guyana | 5.5% |
| 🇷🇼 Rwanda | 5.5% |
| 🇭🇺 Hungary | 5.4% |
| 🇳🇦 Namibia | 5.3% |
| 🇬🇶 Equatorial Guinea | 5.2% |
| 🇧🇹 Bhutan | 5.1% |
| 🇦🇿 Azerbaijan | 5.0% |
| 🇯🇲 Jamaica | 5.0% |
| 🇱🇸 Lesotho | 5.0% |
| 🇲🇩 Moldova | 5.0% |
| 🇷🇺 Russia | 5.0% |
| 🇺🇬 Uganda | 5.0% |
| 🇳🇮 Nicaragua | 4.8% |
| 🇵🇬 Papua New Guinea | 4.7% |
| 🇷🇴 Romania | 4.7% |
| 🇬🇹 Guatemala | 4.6% |
| 🇼🇸 Samoa | 4.5% |
| 🇿🇦 South Africa | 4.5% |
| 🇸🇰 Slovak Republic | 4.5% |
| 🇨🇴 Colombia | 4.5% |
| 🇮🇳 India | 4.4% |
| 🇧🇼 Botswana | 4.4% |
| 🇸🇿 Eswatini | 4.3% |
| 🇱🇻 Latvia | 4.3% |
| 🇭🇳 Honduras | 4.2% |
| 🇳🇷 Nauru | 4.2% |
| 🇧🇪 Belgium | 4.0% |
| 🇮🇸 Iceland | 4.0% |
| 🇹🇿 Tanzania | 4.0% |
| 🇰🇮 Kiribati | 4.0% |
| 🇲🇷 Mauritania | 4.0% |
| 🇵🇾 Paraguay | 4.0% |
| 🇷🇸 Serbia | 4.0% |
| 🇩🇴 Dominican Republic | 4.0% |
| 🇦🇲 Armenia | 4.0% |
| 🇧🇷 Brazil | 3.9% |
| 🇸🇴 Somalia | 3.9% |
| 🇹🇻 Tuvalu | 3.8% |
| 🇧🇴 Bolivia | 3.8% |
| 🇧🇾 Belarus | 3.7% |
| 🇨🇲 Cameroon | 3.7% |
| 🇽🇰 Kosovo | 3.7% |
| 🇪🇪 Estonia | 3.6% |
| 🇧🇧 Barbados | 3.6% |
| 🇸🇧 Solomon Islands | 3.6% |
| 🇦🇱 Albania | 3.6% |
| 🇦🇺 Australia | 3.4% |
| 🇪🇸 Spain | 3.4% |
| 🇵🇭 Philippines | 3.4% |
| 🇻🇳 Vietnam | 3.4% |
| 🇲🇦 Morocco | 3.3% |
| 🇸🇮 Slovenia | 3.3% |
| 🇦🇹 Austria | 3.2% |
| 🇭🇷 Croatia | 3.2% |
| 🇨🇬 Republic of Congo | 3.2% |
| 🇳🇴 Norway | 3.2% |
| 🇸🇬 Singapore | 3.2% |
| 🇲🇽 Mexico | 3.2% |
| 🇹🇩 Chad | 3.1% |
| 🇲🇪 Montenegro | 3.1% |
| 🇱🇹 Lithuania | 3.1% |
| 🇨🇷 Costa Rica | 3.0% |
| 🇰🇭 Cambodia | 3.0% |
| 🇮🇹 Italy | 3.0% |
| 🇨🇱 Chile | 3.0% |
| 🇬🇪 Georgia | 3.0% |
| 🇬🇼 Guinea-Bissau | 3.0% |
| 🇮🇶 Iraq | 3.0% |
| 🇱🇦 Lao P.D.R. | 3.0% |
| 🇫🇲 Micronesia | 3.0% |
| 🇩🇲 Dominica | 2.9% |
| 🇸🇪 Sweden | 2.8% |
| 🇩🇪 Germany | 2.8% |
| 🇬🇷 Greece | 2.7% |
| 🇲🇾 Malaysia | 2.7% |
| 🇮🇪 Ireland | 2.6% |
| 🇯🇵 Japan | 2.6% |
| 🇫🇯 Fiji | 2.6% |
| 🇲🇭 Marshall Islands | 2.6% |
| 🇬🇩 Grenada | 2.6% |
| 🇺🇸 United States | 2.6% |
| 🇵🇹 Portugal | 2.6% |
| 🇮🇱 Israel | 2.6% |
| 🇧🇸 The Bahamas | 2.6% |
| 🇯🇴 Jordan | 2.6% |
| 🇱🇾 Libya | 2.5% |
| 🇳🇿 New Zealand | 2.5% |
| 🇧🇯 Benin | 2.5% |
| 🇩🇰 Denmark | 2.5% |
| 🇩🇯 Djibouti | 2.5% |
| 🇸🇲 San Marino | 2.5% |
| 🇹🇱 Timor-Leste | 2.5% |
| 🇮🇩 Indonesia | 2.5% |
| 🇦🇬 Antigua and Barbuda | 2.5% |
| 🇳🇪 Niger | 2.5% |
| 🇨🇫 Central African Republic | 2.5% |
| 🇵🇸 West Bank and Gaza | 2.5% |
| 🇲🇻 Maldives | 2.4% |
| 🇲🇹 Malta | 2.4% |
| 🇳🇱 Netherlands | 2.4% |
| 🇸🇨 Seychelles | 2.4% |
| 🇬🇧 United Kingdom | 2.4% |
| 🇬🇦 Gabon | 2.4% |
| 🇰🇳 St. Kitts and Nevis | 2.3% |
| 🇭🇰 Hong Kong SAR | 2.3% |
| 🇲🇰 North Macedonia | 2.3% |
| 🇦🇪 UAE | 2.3% |
| 🇹🇹 Trinidad and Tobago | 2.3% |
| 🇶🇦 Qatar | 2.3% |
| 🇵🇦 Panama | 2.2% |
| 🇸🇦 Saudi Arabia | 2.2% |
| 🇵🇪 Peru | 2.2% |
| 🇨🇾 Cyprus | 2.2% |
| 🇨🇿 Czech Republic | 2.2% |
| 🇹🇬 Togo | 2.2% |
| 🇧🇬 Bulgaria | 2.2% |
| 🇦🇼 Aruba | 2.2% |
| 🇨🇦 Canada | 2.1% |
| 🇧🇦 Bosnia and Herzegovina | 2.1% |
| 🇱🇨 St. Lucia | 2.1% |
| 🇦🇩 Andorra | 2.0% |
| 🇧🇫 Burkina Faso | 2.0% |
| 🇨🇻 Cabo Verde | 2.0% |
| 🇨🇮 Côte d'Ivoire | 2.0% |
| 🇰🇷 Korea | 2.0% |
| 🇲🇱 Mali | 2.0% |
| 🇻🇨 St. Vincent and the Grenadines | 2.0% |
| 🇨🇭 Switzerland | 1.9% |
| 🇵🇷 Puerto Rico | 1.9% |
| 🇨🇳 China | 1.9% |
| 🇫🇮 Finland | 1.9% |
| 🇫🇷 France | 1.9% |
| 🇹🇼 Taiwan | 1.8% |
| 🇵🇼 Palau | 1.8% |
| 🇹🇭 Thailand | 1.8% |
| 🇱🇺 Luxembourg | 1.7% |
| 🇸🇻 El Salvador | 1.7% |
| 🇲🇴 Macao SAR | 1.7% |
| 🇴🇲 Oman | 1.7% |
| 🇰🇲 Comoros | 1.6% |
| 🇧🇳 Brunei Darussalam | 1.5% |
| 🇪🇨 Ecuador | 1.5% |
| 🇧🇭 Bahrain | 1.4% |
| 🇧🇿 Belize | 1.2% |
| 🇸🇳 Senegal | 0.3% |
Venezuela, with the largest oil reserves globally, is projected to see inflation reach 230%—the highest overall.
Across the last decade, the country has faced hyperinflation, reaching a stunning 10 million percent in 2019. Since U.S. sanctions were lifted last year, inflation has fallen dramatically due to sharp cuts in government spending and increasing dollarization of the economy, which is bolstering the bolivar.
In America, slower economic growth coupled with a softening labor market could ease inflation, which is forecast to reach 2.6% in 2024. While the Federal Reserve has signaled that the worst is over, unexpected momentum across the economy could cloud the outcome. As of November 2023, $290 billion in excess savings were held across American households, which may continue to spur consumer demand.
Over in Europe, inflation is anticipated to average 3.3% across advanced economies. Today, sinking natural gas prices and low GDP growth are keeping inflation expectations at bay.
China, the world’s second-largest economy, is contending with falling prices due to property market trouble, which drives about a third of the country’s economic growth. Amid sluggish economic activity, a manufacturing slowdown, and low consumer confidence, inflation is forecast to reach 1.7%.
What Could Cause Inflation to Re-Accelerate?
While inflation shocks driven from the pandemic appear to be over, key risks could drive up inflation:
- Geopolitical Pressures: Rising shipping costs due to the conflict in the Middle East and Red Sea could continue to escalate and energy prices could increase amid disrupted supply, driving inflation higher.
- Strong Consumer Demand: Accumulated excess savings could continue to fuel economies, leading central banks to remain hawkish. Persistently high wage growth—which increased about double the pre-pandemic average across advanced nations in 2023—could boost consumption and higher prices.
- Rising Housing Costs: Shelter makes up about a third of the Consumer Price Index, the biggest component overall. If prices accelerate, it presents key inflationary risks. As of January 2024, U.S. shelter costs increased 6% annually.
So far, the global economy has been resilient. While risk factors remain, inflation projections suggest that the path towards a 2% target is slow, but going in the right direction.


Markets
The European Stock Market: Attractive Valuations Offer Opportunities
On average, the European stock market has valuations that are nearly 50% lower than U.S. valuations. But how can you access the market?


European Stock Market: Attractive Valuations Offer Opportunities
Europe is known for some established brands, from L’Oréal to Louis Vuitton. However, the European stock market offers additional opportunities that may be lesser known.
The above infographic, sponsored by STOXX, outlines why investors may want to consider European stocks.
Attractive Valuations
Compared to most North American and Asian markets, European stocks offer lower or comparable valuations.
| Index | Price-to-Earnings Ratio | Price-to-Book Ratio |
|---|---|---|
| EURO STOXX 50 | 14.9 | 2.2 |
| STOXX Europe 600 | 14.4 | 2 |
| U.S. | 25.9 | 4.7 |
| Canada | 16.1 | 1.8 |
| Japan | 15.4 | 1.6 |
| Asia Pacific ex. China | 17.1 | 1.8 |
Data as of February 29, 2024. See graphic for full index names. Ratios based on trailing 12 month financials. The price to earnings ratio excludes companies with negative earnings.
On average, European valuations are nearly 50% lower than U.S. valuations, potentially offering an affordable entry point for investors.
Research also shows that lower price ratios have historically led to higher long-term returns.
Market Movements Not Closely Connected
Over the last decade, the European stock market had low-to-moderate correlation with North American and Asian equities.
The below chart shows correlations from February 2014 to February 2024. A value closer to zero indicates low correlation, while a value of one would indicate that two regions are moving in perfect unison.
| EURO STOXX 50 | STOXX EUROPE 600 | U.S. | Canada | Japan | Asia Pacific ex. China |
|
|---|---|---|---|---|---|---|
| EURO STOXX 50 | 1.00 | 0.97 | 0.55 | 0.67 | 0.24 | 0.43 |
| STOXX EUROPE 600 | 1.00 | 0.56 | 0.71 | 0.28 | 0.48 | |
| U.S. | 1.00 | 0.73 | 0.12 | 0.25 | ||
| Canada | 1.00 | 0.22 | 0.40 | |||
| Japan | 1.00 | 0.88 | ||||
| Asia Pacific ex. China | 1.00 |
Data is based on daily USD returns.
European equities had relatively independent market movements from North American and Asian markets. One contributing factor could be the differing sector weights in each market. For instance, technology makes up a quarter of the U.S. market, but health care and industrials dominate the broader European market.
Ultimately, European equities can enhance portfolio diversification and have the potential to mitigate risk for investors.
Tracking the Market
For investors interested in European equities, STOXX offers a variety of flagship indices:
| Index | Description | Market Cap |
|---|---|---|
| STOXX Europe 600 | Pan-regional, broad market | €10.5T |
| STOXX Developed Europe | Pan-regional, broad-market | €9.9T |
| STOXX Europe 600 ESG-X | Pan-regional, broad market, sustainability focus | €9.7T |
| STOXX Europe 50 | Pan-regional, blue-chip | €5.1T |
| EURO STOXX 50 | Eurozone, blue-chip | €3.5T |
Data is as of February 29, 2024. Market cap is free float, which represents the shares that are readily available for public trading on stock exchanges.
The EURO STOXX 50 tracks the Eurozone’s biggest and most traded companies. It also underlies one of the world’s largest ranges of ETFs and mutual funds. As of November 2023, there were €27.3 billion in ETFs and €23.5B in mutual fund assets under management tracking the index.
“For the past 25 years, the EURO STOXX 50 has served as an accurate, reliable and tradable representation of the Eurozone equity market.”
— Axel Lomholt, General Manager at STOXX
Partnering with STOXX to Track the European Stock Market
Are you interested in European equities? STOXX can be a valuable partner:
- Comprehensive, liquid and investable ecosystem
- European heritage, global reach
- Highly sophisticated customization capabilities
- Open architecture approach to using data
- Close partnerships with clients
- Part of ISS STOXX and Deutsche Börse Group
With a full suite of indices, STOXX can help you benchmark against the European stock market.
Learn how STOXX’s European indices offer liquid and effective market access.

-

 Economy2 days ago
Economic Growth Forecasts for G7 and BRICS Countries in 2024
The IMF has released its economic growth forecasts for 2024. How do the G7 and BRICS countries compare?
-

 Markets1 week ago
U.S. Debt Interest Payments Reach $1 Trillion
U.S. debt interest payments have surged past the $1 trillion dollar mark, amid high interest rates and an ever-expanding debt burden.
-

 United States2 weeks ago
Ranked: The Largest U.S. Corporations by Number of Employees
We visualized the top U.S. companies by employees, revealing the massive scale of retailers like Walmart, Target, and Home Depot.
-

 Markets2 weeks ago
The Top 10 States by Real GDP Growth in 2023
This graphic shows the states with the highest real GDP growth rate in 2023, largely propelled by the oil and gas boom.
-

 Markets2 weeks ago
Ranked: The World’s Top Flight Routes, by Revenue
In this graphic, we show the highest earning flight routes globally as air travel continued to rebound in 2023.
-

 Markets2 weeks ago
Ranked: The Most Valuable Housing Markets in America
The U.S. residential real estate market is worth a staggering $47.5 trillion. Here are the most valuable housing markets in the country.

-

 Misc1 week ago
How Hard Is It to Get Into an Ivy League School?
-

 Technology2 weeks ago
Ranked: Semiconductor Companies by Industry Revenue Share
-
Markets2 weeks ago
Ranked: The World’s Top Flight Routes, by Revenue
-

 Countries2 weeks ago
Population Projections: The World’s 6 Largest Countries in 2075
-
Markets2 weeks ago
The Top 10 States by Real GDP Growth in 2023
-

 Demographics2 weeks ago
The Smallest Gender Wage Gaps in OECD Countries
-

 United States2 weeks ago
Where U.S. Inflation Hit the Hardest in March 2024
-

 Environment2 weeks ago
Top Countries By Forest Growth Since 2001