Maps
Mapped: How Houthi Attacks in the Red Sea Impact the Global Economy
How Houthi Attacks in the Red Sea Impact the Global Economy
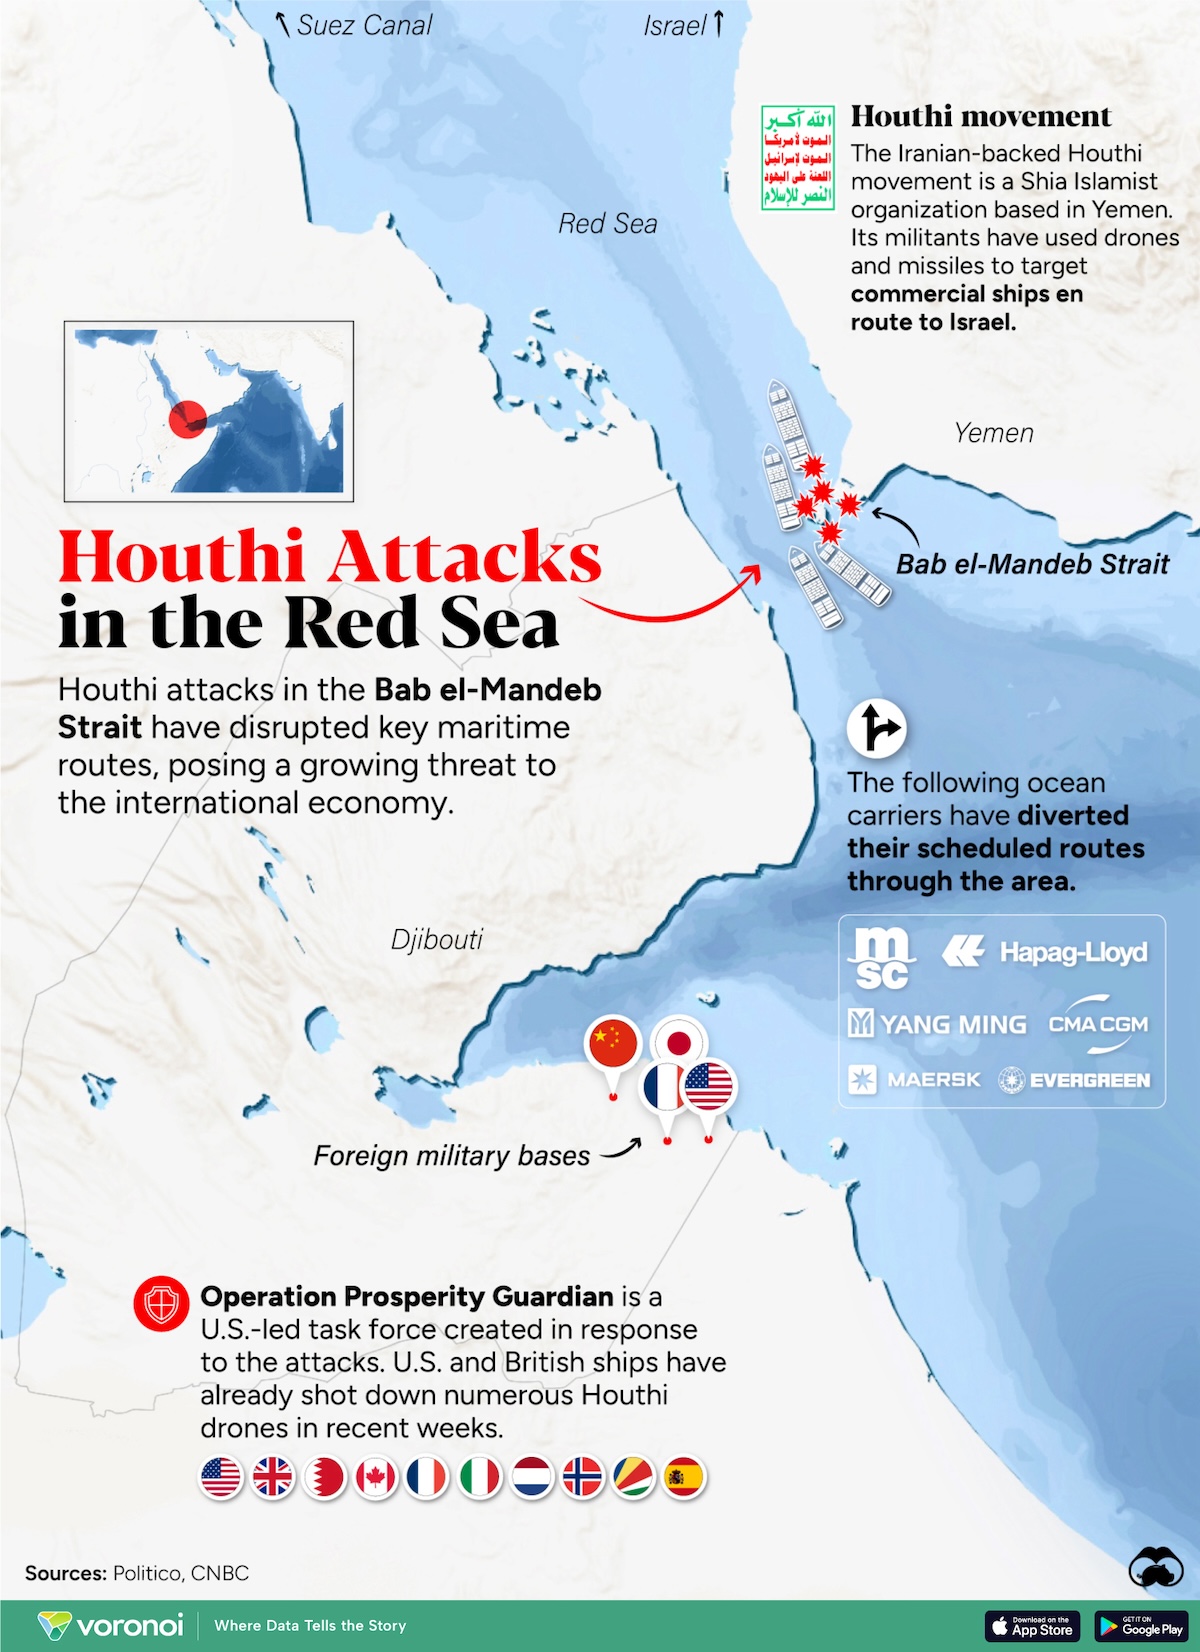
Since October 7th, Houthi militants in Yemen have been targeting commercial cargo ships in the Red Sea, severely disrupting maritime trade.
The Iranian-backed group is using drones to attack vessels that they believe are delivering goods to Israel, forcing ocean carriers like MSC and Hapag-Lloyd to to cancel and detour routes originally meant to pass through the Red Sea.
These strikes are occurring in the crucial Bab al-Mandab Strait, which connects the Red Sea to the Arabian sea, and is bordered by the Yemen on one side and Djibouti and Eritrea on the other.
The Houthis, a Shiite minority sect in Yemen, wrested control of large portions of the country, including the capital Sanaa and a key Red Sea port, Al-Hudaydah, from the Saudi Arabian-backed Sunni government in 2014.
Their latest attacks are pushing shipping companies to avoid the Red Sea, in turn preventing access to the Suez Canal, through which nearly 12% of global maritime trade passes through.
What do Houthi Attacks in the Red Sea Mean for the International Economy?
The world economy has already had a difficult two years, with inflation sparking a cost of living crisis across many countries.
Now, ships diverted from the Suez Canal will be forced to go around the Cape of Good Hope, much like trade did before the Suez Canal existed.
This longer journey increases fuel costs, reduces shipping efficiencies, and could raise the prices of imported goods, which includes critical shipments of grain from Asia and oil from the Middle East.
The price of Brent Crude has already climbed 8% in the last week.
| Rank | Shipping Lane | Ships/Day | Connects |
|---|---|---|---|
| 1 | English Channel | 400 | UK/Europe |
| 2 | Malacca Strait | 230 | Asia/Middle East/Europe |
| 3 | Strait of Hormuz | 55 | Iran/Oman/UAE |
| 4 | Suez Canal | 50 | Asia/Middle East/Europe |
| 5 | Panama Canal | 38 | East/West Coast Americas/Asia |
Source: TEC Container Solutions.
Meanwhile, operators of the Panama Canal, another key shipping lane, have had to reduce traffic through the passageway due to a prolonged drought in the country, also disrupting global shipping.
In response to the Houthi attacks, the U.S. has recently announced a defense coalition leading nine other nations that will work together to strengthen security in the area.


Maps
The Largest Earthquakes in the New York Area (1970-2024)
The earthquake that shook buildings across New York in April 2024 was the third-largest quake in the Northeast U.S. over the past 50 years.


The Largest Earthquakes in the New York Area
This was originally posted on our Voronoi app. Download the app for free on Apple or Android and discover incredible data-driven charts from a variety of trusted sources.
The 4.8 magnitude earthquake that shook buildings across New York on Friday, April 5th, 2024 was the third-largest quake in the U.S. Northeast area over the past 50 years.
In this map, we illustrate earthquakes with a magnitude of 4.0 or greater recorded in the Northeastern U.S. since 1970, according to the United States Geological Survey (USGS).
Shallow Quakes and Older Buildings
The earthquake that struck the U.S. Northeast in April 2024 was felt by millions of people from Washington, D.C., to north of Boston. It even caused a full ground stop at Newark Airport.
The quake, occurring just 5 km beneath the Earth’s surface, was considered shallow, which is what contributed to more intense shaking at the surface.
According to the USGS, rocks in the eastern U.S. are significantly older, denser, and harder than those on the western side, compressed by time. This makes them more efficient conduits for seismic energy. Additionally, buildings in the Northeast tend to be older and may not adhere to the latest earthquake codes.
Despite disrupting work and school life, the earthquake was considered minor, according to the Michigan Technological University magnitude scale:
| Magnitude | Earthquake Effects | Estimated Number Each Year |
|---|---|---|
| 2.5 or less | Usually not felt, but can be recorded by seismograph. | Millions |
| 2.5 to 5.4 | Often felt, but only causes minor damage. | 500,000 |
| 5.5 to 6.0 | Slight damage to buildings and other structures. | 350 |
| 6.1 to 6.9 | May cause a lot of damage in very populated areas. | 100 |
| 7.0 to 7.9 | Major earthquake. Serious damage. | 10-15 |
| 8.0 or greater | Great earthquake. Can totally destroy communities near the epicenter. | One every year or two |
The largest earthquake felt in the area over the past 50 years was a 5.3 magnitude quake that occurred in Au Sable Forks, New York, in 2002. It damaged houses and cracked roads in a remote corner of the Adirondack Mountains, but caused no injuries.
| Date | Magnitude | Location | State |
|---|---|---|---|
| April 20, 2002 | 5.3 | Au Sable Forks | New York |
| October 7, 1983 | 5.1 | Newcomb | New York |
| April 5, 2024 | 4.8 | Whitehouse Station | New Jersey |
| October 16, 2012 | 4.7 | Hollis Center | Maine |
| January 16, 1994 | 4.6 | Sinking Spring | Pennsylvania |
| January 19, 1982 | 4.5 | Sanbornton | New Hampshire |
| September 25, 1998 | 4.5 | Adamsville | Pennsylvania |
| June 9, 1975 | 4.2 | Altona | New York |
| May 29, 1983 | 4.2 | Peru | Maine |
| April 23, 1984 | 4.2 | Conestoga | Pennsylvania |
| January 16, 1994 | 4.2 | Sinking Spring | Pennsylvania |
| November 3, 1975 | 4 | Long Lake | New York |
| June 17, 1991 | 4 | Worcester | New York |
The largest earthquake in U.S. history, however, was the 1964 Good Friday quake in Alaska, measuring 9.2 magnitude and killing 131 people.

-

 Debt1 week ago
How Debt-to-GDP Ratios Have Changed Since 2000
-

 Markets2 weeks ago
Ranked: The World’s Top Flight Routes, by Revenue
-

 Demographics2 weeks ago
Population Projections: The World’s 6 Largest Countries in 2075
-

 Markets2 weeks ago
The Top 10 States by Real GDP Growth in 2023
-

 Demographics2 weeks ago
The Smallest Gender Wage Gaps in OECD Countries
-

 Economy2 weeks ago
Where U.S. Inflation Hit the Hardest in March 2024
-

 Green2 weeks ago
Top Countries By Forest Growth Since 2001
-

 United States2 weeks ago
Ranked: The Largest U.S. Corporations by Number of Employees